58% of all failures were detected during visual inspection, with 50% of manufacturers having at least one visual inspection failure. The two largest subcategories of these were delamination detected during pre-stress, TC, DH and MSS, and junction box covers falling off at pre-stress, or during DH or hail testing.
Failure Types
Safety Failure
Modules with safety failures may be hazardous to operate in the field. Throughout PQP testing, safe operation is determined via wet leakage testing using the IEC 61215 standard, which evaluates the electrical insulation of the PV module. BOMs not meeting the IEC 61215 minimum requirements for insulation resistance are included in the Scorecard’s failure statistics.
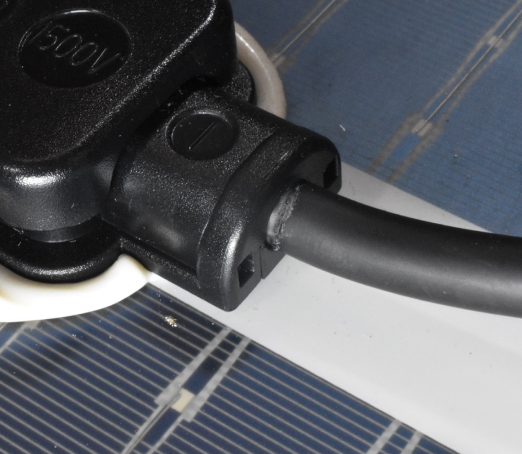
This module failed wet leakage testing following LETID testing. Kiwa PVEL’s investigation revealed that the cable’s conductors had become exposed at the junction box gland. This was a failure mode detected on at least five different BOMs from at least three manufacturers within the past year.
Visual Inspection
Visual inspections identify issues that cause premature field failure. Modules are examined for delamination, corrosion, broken or cracked surfaces and other ‘major’ defects using the IEC 61215 criteria. BOMs exhibiting ‘major’ visual inspection findings are included in the Scorecard’s failure statistics.
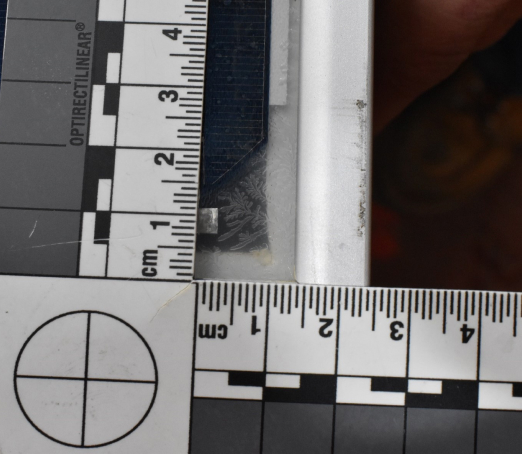
This module experienced delamination along the module perimeter following PID testing. This results in electrical creepage distance below the IEC 61730 required minimum and is therefore considered a ‘major defect’. Kiwa PVEL has observed a significant increase in this failure mode within the past year, with ten manufacturers submitting modules that exhibited this form of delamination.
Power Degradation
Modules with power degradation failures may underperform in the field. Although the PQP does not assign specific pass/fail thresholds for degradation, manufacturers may initiate a retest if power loss exceeds their or their customers’ expectations. Retests are clearly noted in PQP reports. BOMs that undergo a retest due to power loss are included in the Scorecard’s failure statistics.
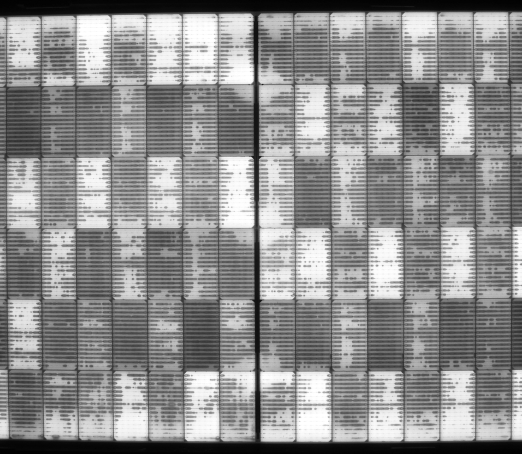
This module degraded over 15% following PID testing. While likely due to polarization, which may be reversible, this was a particularly egregious case. Nine manufacturers experienced significantly high rates of PID polarization in the past year.
Diode
Kiwa PVEL evaluates the functionality of the module’s bypass diodes after TC and MSS testing. A failed bypass diode can no longer protect the module from hot spots, which could lead to fire risk. BOMs with non-functioning diodes in reverse and/or forward bias are included in the Scorecard’s failure statistics.
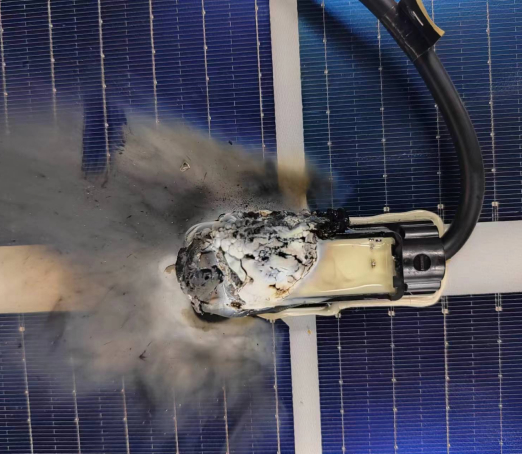
A junction box experienced a rapid unscheduled disassembly during TC testing, resulting in rear glass breakage. This was likely caused by an electrical arc within the bypass diode or a JB soldering issue. Four manufacturers had failing bypass diodes in the past year of PQP testing.
Key
Takeaways
Visual inspection was once again the leading failure category.
Percentage of BOMs experiencing a safety failure more than halved.
Only 7% of BOMs experienced a wet leakage electrical insulation (or “safety”) failure. This was down from the 18% reported in the 2023 Scorecard. The number of pre-stress safety failures also decreased from 7% of BOMs in the 2023 Scorecard to just over 2% of BOMs for the 2024 Scorecard.
Power loss failures increase for TC and DH; stay high for PID.
The percentage of BOMs experiencing a power loss related failure increased for DH and TC, from 0% and 2% in the 2023 Scorecard, to 3% and 4%, respectively. This was likely due to the choice of more aggressive encapsulant and/or cell metallization materials. The percentage of PID BOMs experiencing a failure remained at approximately 6% for the past two Scorecards.
34% of manufacturers had one or more junction box related failure.
Kiwa PVEL has highlighted the issue of junction box failures in the past five editions of the Scorecard, yet these failures persist. They include 17% of manufacturers with junction box covers falling off, 11% of manufacturers with wet leakage/safety failures traced to the junction box, 8% of manufacturers with bypass diode failures, and 6% of manufacturers with melted/damaged connectors.
PQP Failure Statistics
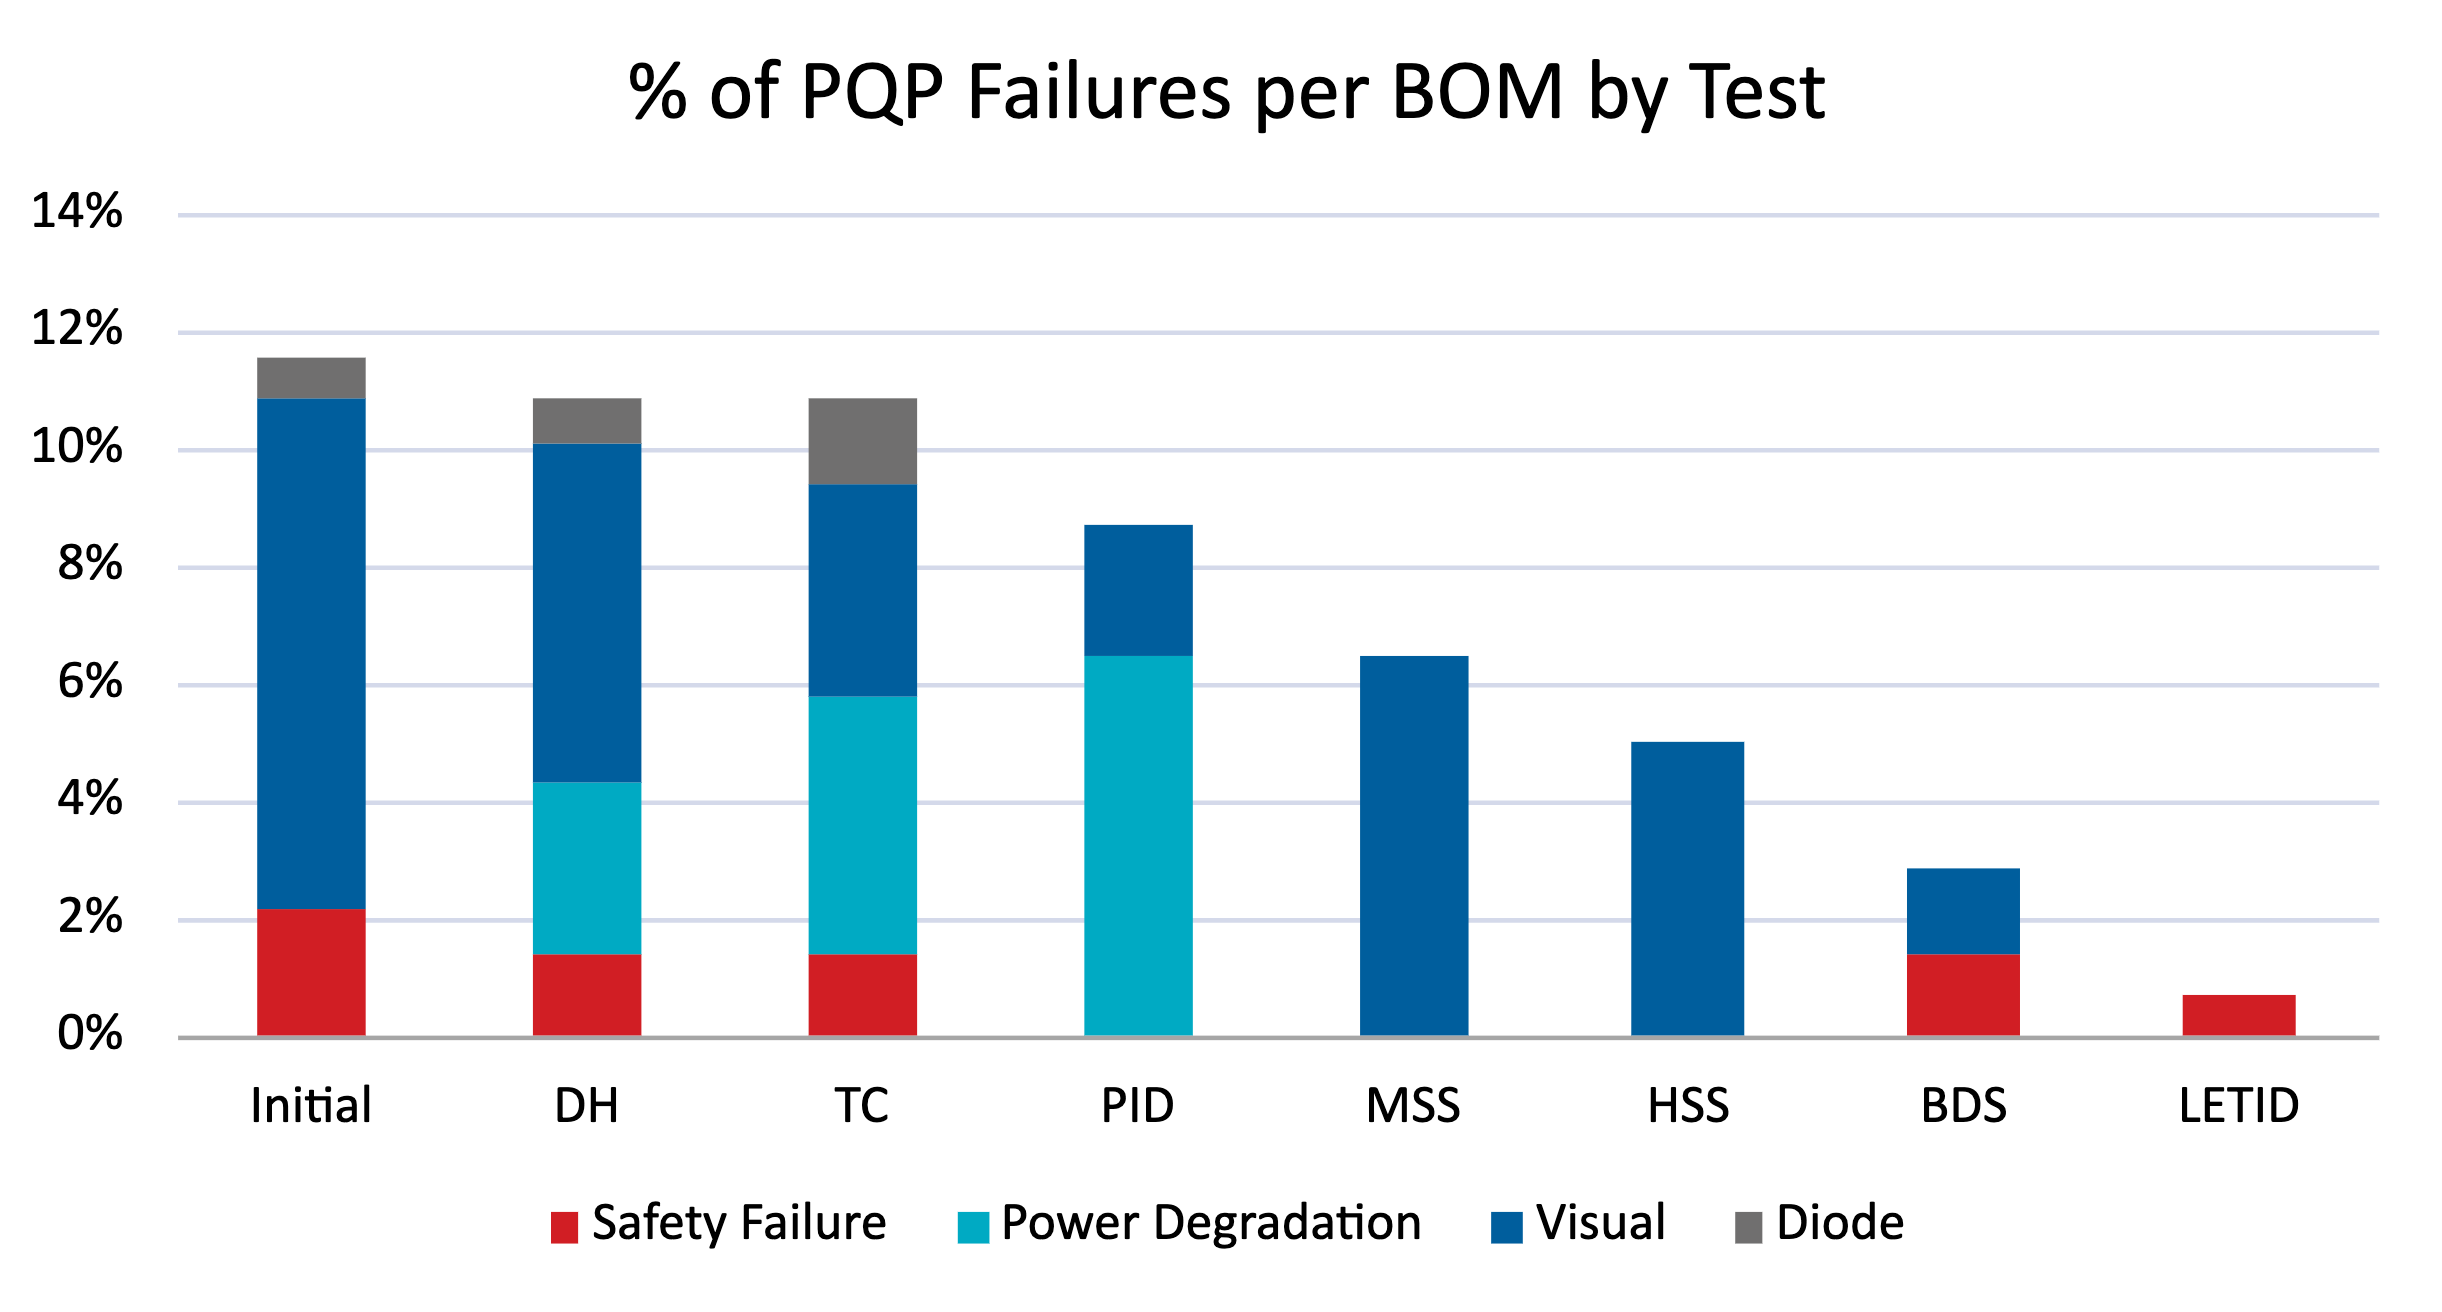
This graph shows the percentage of BOMs experiencing a failure in each test sequence of the PQP by failure type.
The most common type of failure is visual inspection major defect, causing more than half of the recorded failures. This is followed by power degradation failures.
Initial failures are those that were detected during characterizations prior to stress-testing.
UVID failures are not shown. Visit the UVID page to learn more.
Procure better modules. Get access to the Scorecard data every quarter.
Sign up as a Kiwa PVEL Premium Partner