With an increase in the number of TOPCon modules included in the PAN dataset for the 2024 Scorecard, the Top Performer energy yield threshold for Kiwa PVEL’s modelled site in Las Vegas increased by 0.95% compared to what was reported in the 2023 Scorecard. This was driven by improved temperature coefficients and bifaciality compared to PERC modules.
PAN Performance

Kiwa PVEL’s PAN testing and .pan file generation enhance PV module performance simulations by using empirical data across a range of temperature and irradiance conditions. This is an essential input for accurate energy models. Unlike manufacturer-provided PAN files, which might lack empirical validation, Kiwa PVEL’s comprehensive testing ensures .pan files reflect real-world conditions more accurately, supporting better decision-making in module procurement and project development.
Key
Takeaways
- Higher Energy Yields
- Temperature Coefficient Advantages
- Bifaciality Gains for HJT and TOPCon
- Low Light Performance
PAN performance shows notable improvements.
Clear temperature coefficient benefits for HJT.
The limited number of HJT BOMs in the 2024 Scorecard dataset showed an average Pmp temperature coefficient of -0.26 %/°C compared to -0.30%/°C for TOPCon and -0.32%/°C for PERC. These values are closely aligned with what was reported in the 2023 Scorecard and speak to HJT’s continued energy yield advantages.
HJT’s higher bifacialities lead to better energy yields.
Although the HJT sample size was much smaller than TOPCon or PERC, HJT’s measured bifacialities are clearly higher. The average HJT bifaciality was 86.7% compared to 75.4% for TOPCon and 69.3% for PERC. This leads to significantly higher modelled energy yield for HJT, followed by TOPCon, when compared to PERC modules.
Slight uptick for PERC but a downward trend for TOPCon.
PERC’s low light performance (as measured via the relative efficiency deviation at 200 W/m2 compared to 1000 W/m2) marginally improved from -3.6% for BOMs produced in 2022 to -3.4% for 2023 BOMs. Meanwhile, TOPCon’s low light performance decreased from a median of -3.5% for 2022 BOMs to -4.3% for 2023 BOMs.
Test Result Spotlight
A bifaciality specification is missing on a surprising number of module datasheets, but when it is included, most datasheets state 75 ± 5% for PERC and 80 ± 10% for TOPCon modules. Kiwa PVEL’s measured bifaciality for PERC supports this specification; however, Kiwa PVEL has not measured any TOPCon BOMs with an average bifaciality exceeding the 80% datasheet value, and 29% of TOPCon BOMs had a measured bifaciality less than 75%. While still within the often stated -10% range, differences between the measured and specified values can be meaningful to energy yields. For example, changing from the specified bifaciality of 80% to the measured value of 74% for a recently tested TOPCon BOM resulted in the PVsyst simulated specific energy yield decreasing by 0.8% for a fixed tilt system and 0.5% for a single-axis tracker system in Las Vegas, NV.
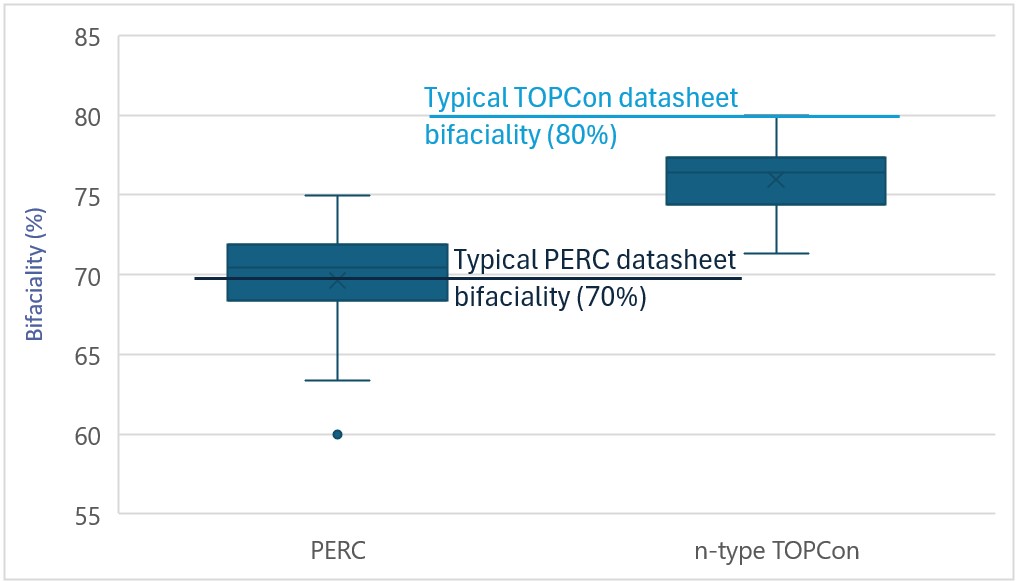
The measured bifaciality across the 2024 Scorecard dataset compared to the typical datasheet specified bifaciality for PERC and TOPCon. Kiwa PVEL’s data supports the PERC specification, but none of the >50 bifacial TOPCon BOMs tested by Kiwa PVEL reached the 80% bifaciality stated on most datasheets.
PAN Energy Yields
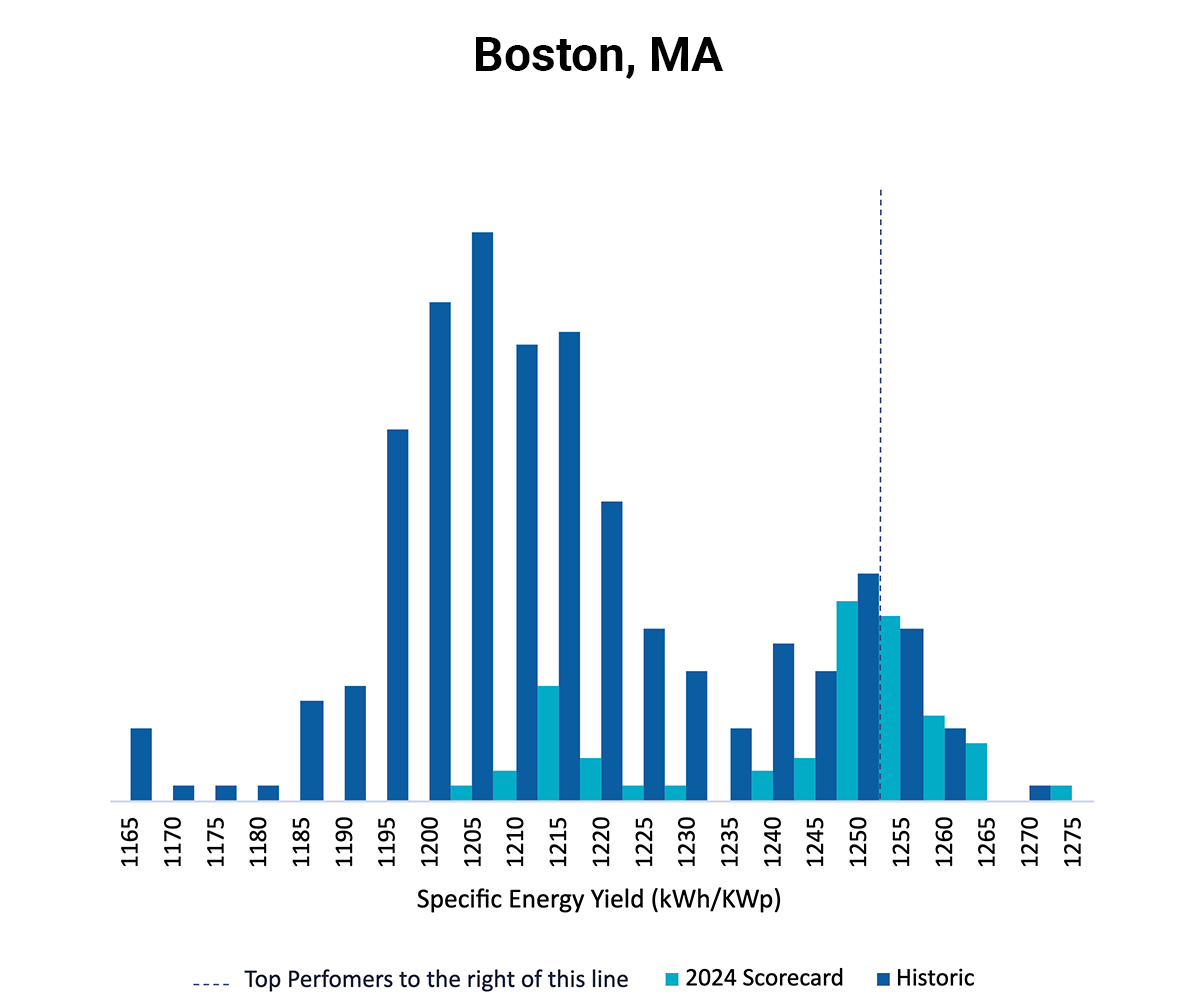
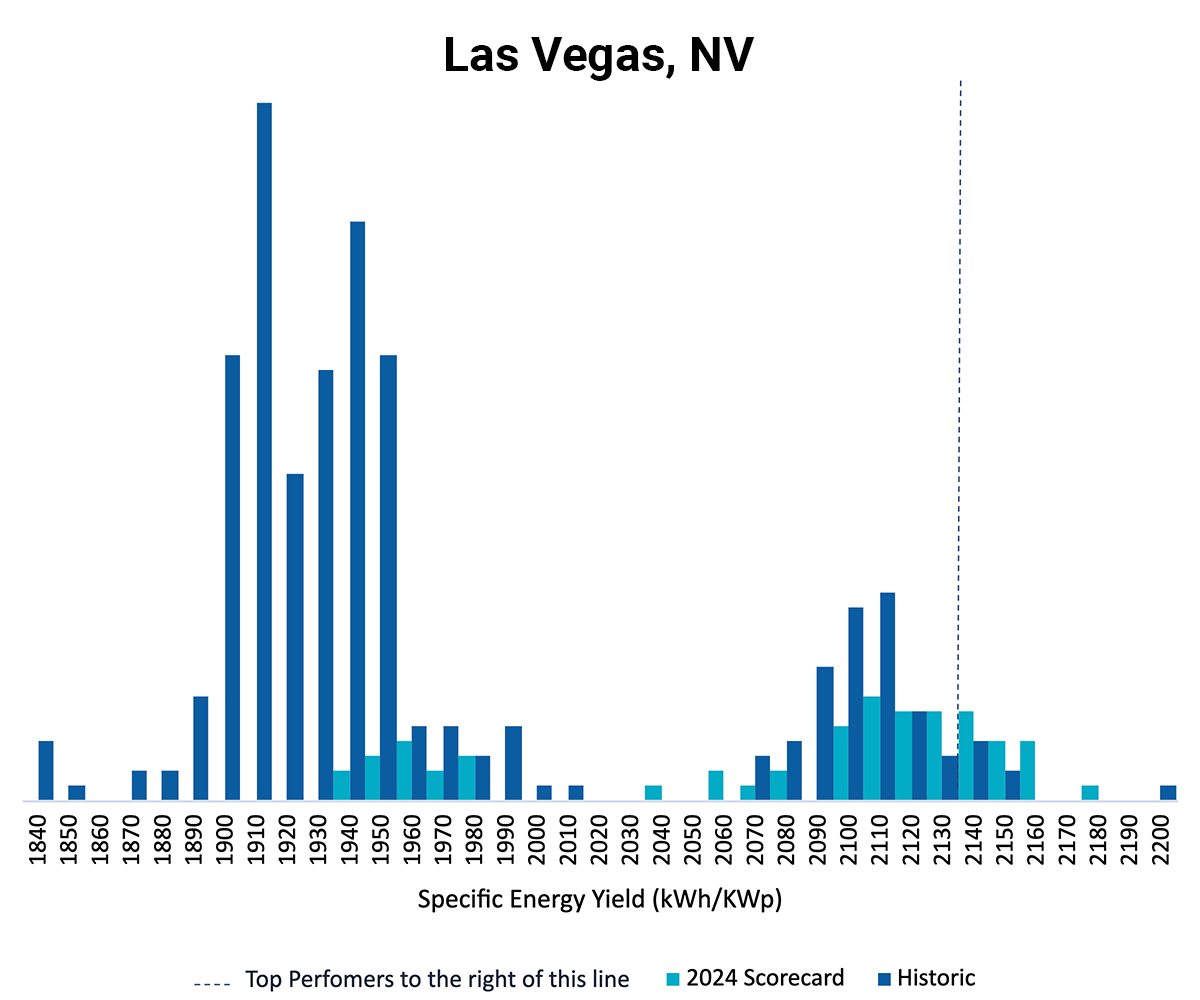
To illustrate the impact of Kiwa PVEL’s PAN files, each PAN report includes simulations based on the Kiwa PVEL-generated PAN file for two sites: a 1 MW site in a temperate climate at a 0° tilt in Boston, USA, and a 1 MW site in a desert climate at 20° tilt in Las Vegas, USA. The PAN reports also include single-axis tracker simulations for the same locations. The result of each of these simulations is a specific energy yield (kWh/kWp) value which can be used for benchmarking purposes.
A case study on why PAN is important, what PV module materials are assessed, and the test procedure for PAN and IAM can be found here on kiwa.com/pvel.

Procure better modules. Get access to the Scorecard data every quarter.
Sign up as a Kiwa PVEL Premium Partner