This is a significant decrease from the 79% of BOMs reported in last year’s Scorecard. The median degradation following PID increased from 1.1% for BOMs produced in 2022 to 1.8% for BOMs produced in 2023, and the average degradation increased from 1.6% to 2.1%. See the Power Degradation graph below for more.
Potential- Induced Degradation

The PQP’s Potential Induced Degradation (PID) test doubles the IEC/UL certification test duration to 192 hours. PID occurs primarily in electrically ungrounded PV systems with high voltages, especially those using transformerless inverters. There are multiple forms of PID, including PID-shunting and PID-polarity. PID-shunting occurs when sodium ions from the glass travel to pinholes in the anti-reflective coatings on the cells, permanently lowering performance. PID-polarity is static charge build-up due to internal circuit voltages, and is possibly reversible.
Key
Takeaways
Only 58% of BOMs tested degraded by < 2%.
Results were aligned across module types and cell technologies.
The median and average degradation for glass//glass, glass//backsheet, PERC and TOPCon all ranged from 1.6 to 2.0% and 2.0 to 2.3% respectively. None of these module types or cell technologies were meaningful indicators of PID susceptibility.
The choice of encapsulant supplier/type can impact PID results.
One manufacturer submitted three TOPCon glass//glass BOMs using the identical cell model, but with front POE and rear EVA from three different encapsulant suppliers. The PID power loss for the three BOMs was 1.1%, 2.69% and 3.3%, showing the clear impact of encapsulant supplier on PID performance.
11 manufacturers experienced a "failure" during PID testing.
While a few of these were undoubtedly manufacturing defects (for example, a junction box fell off a PID module), most were due to power degradation caused by PID-polarity, which is often reversible with a UV exposure. The field relevance of this degradation and/or recovery remain open questions for the industry. See the Failures page for more.
Test Result Spotlight
Potential induced degradation can take many forms, including PID-s (shunting), PID-c (corrosion), and PID-p (polarization). Recent PQP testing has revealed an increasing number of BOMs that are susceptible to PID-p, including the TOPCon module shown here. Kiwa PVEL’s testing has confirmed that many BOMs do not exhibit PID-p, but others can suffer a significant amount of power loss. While a subsequent short duration exposure to UV light can often reverse this effect, some research has shown examples of PID-p occurring in the field.
Pre-stress
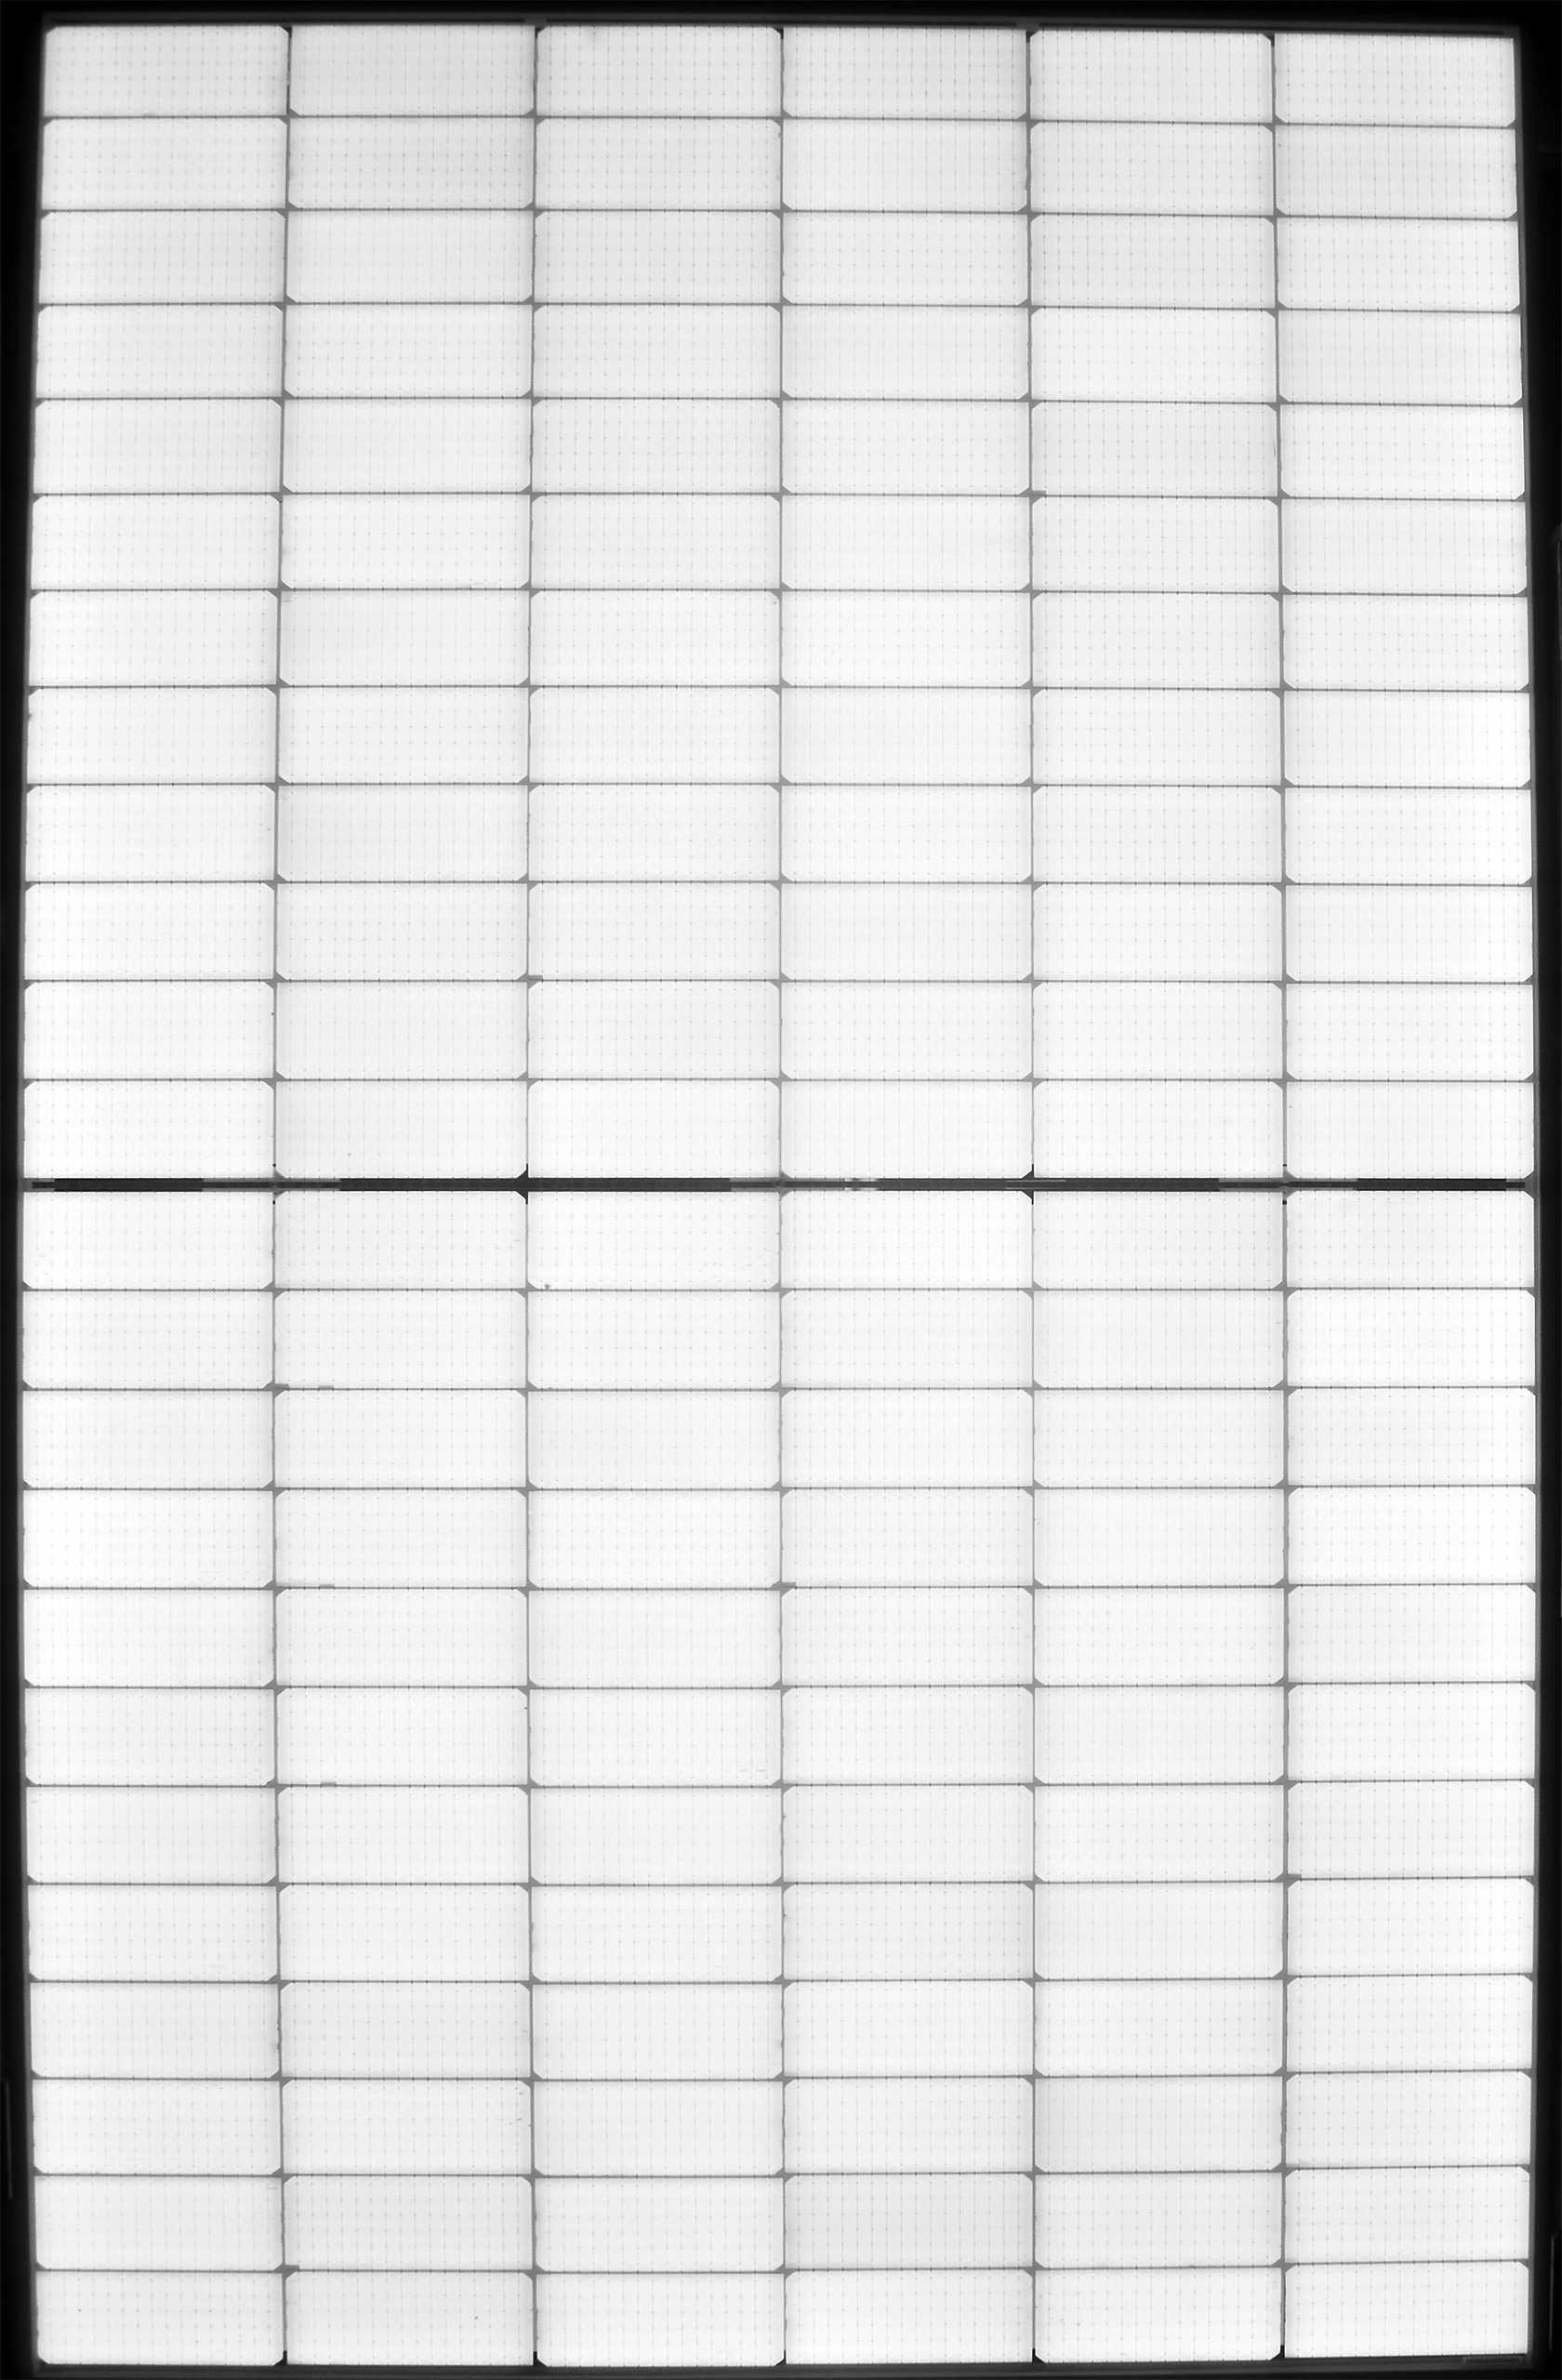
The pre-stress image shows a perfect module with no EL anomalies.
PID192(-)
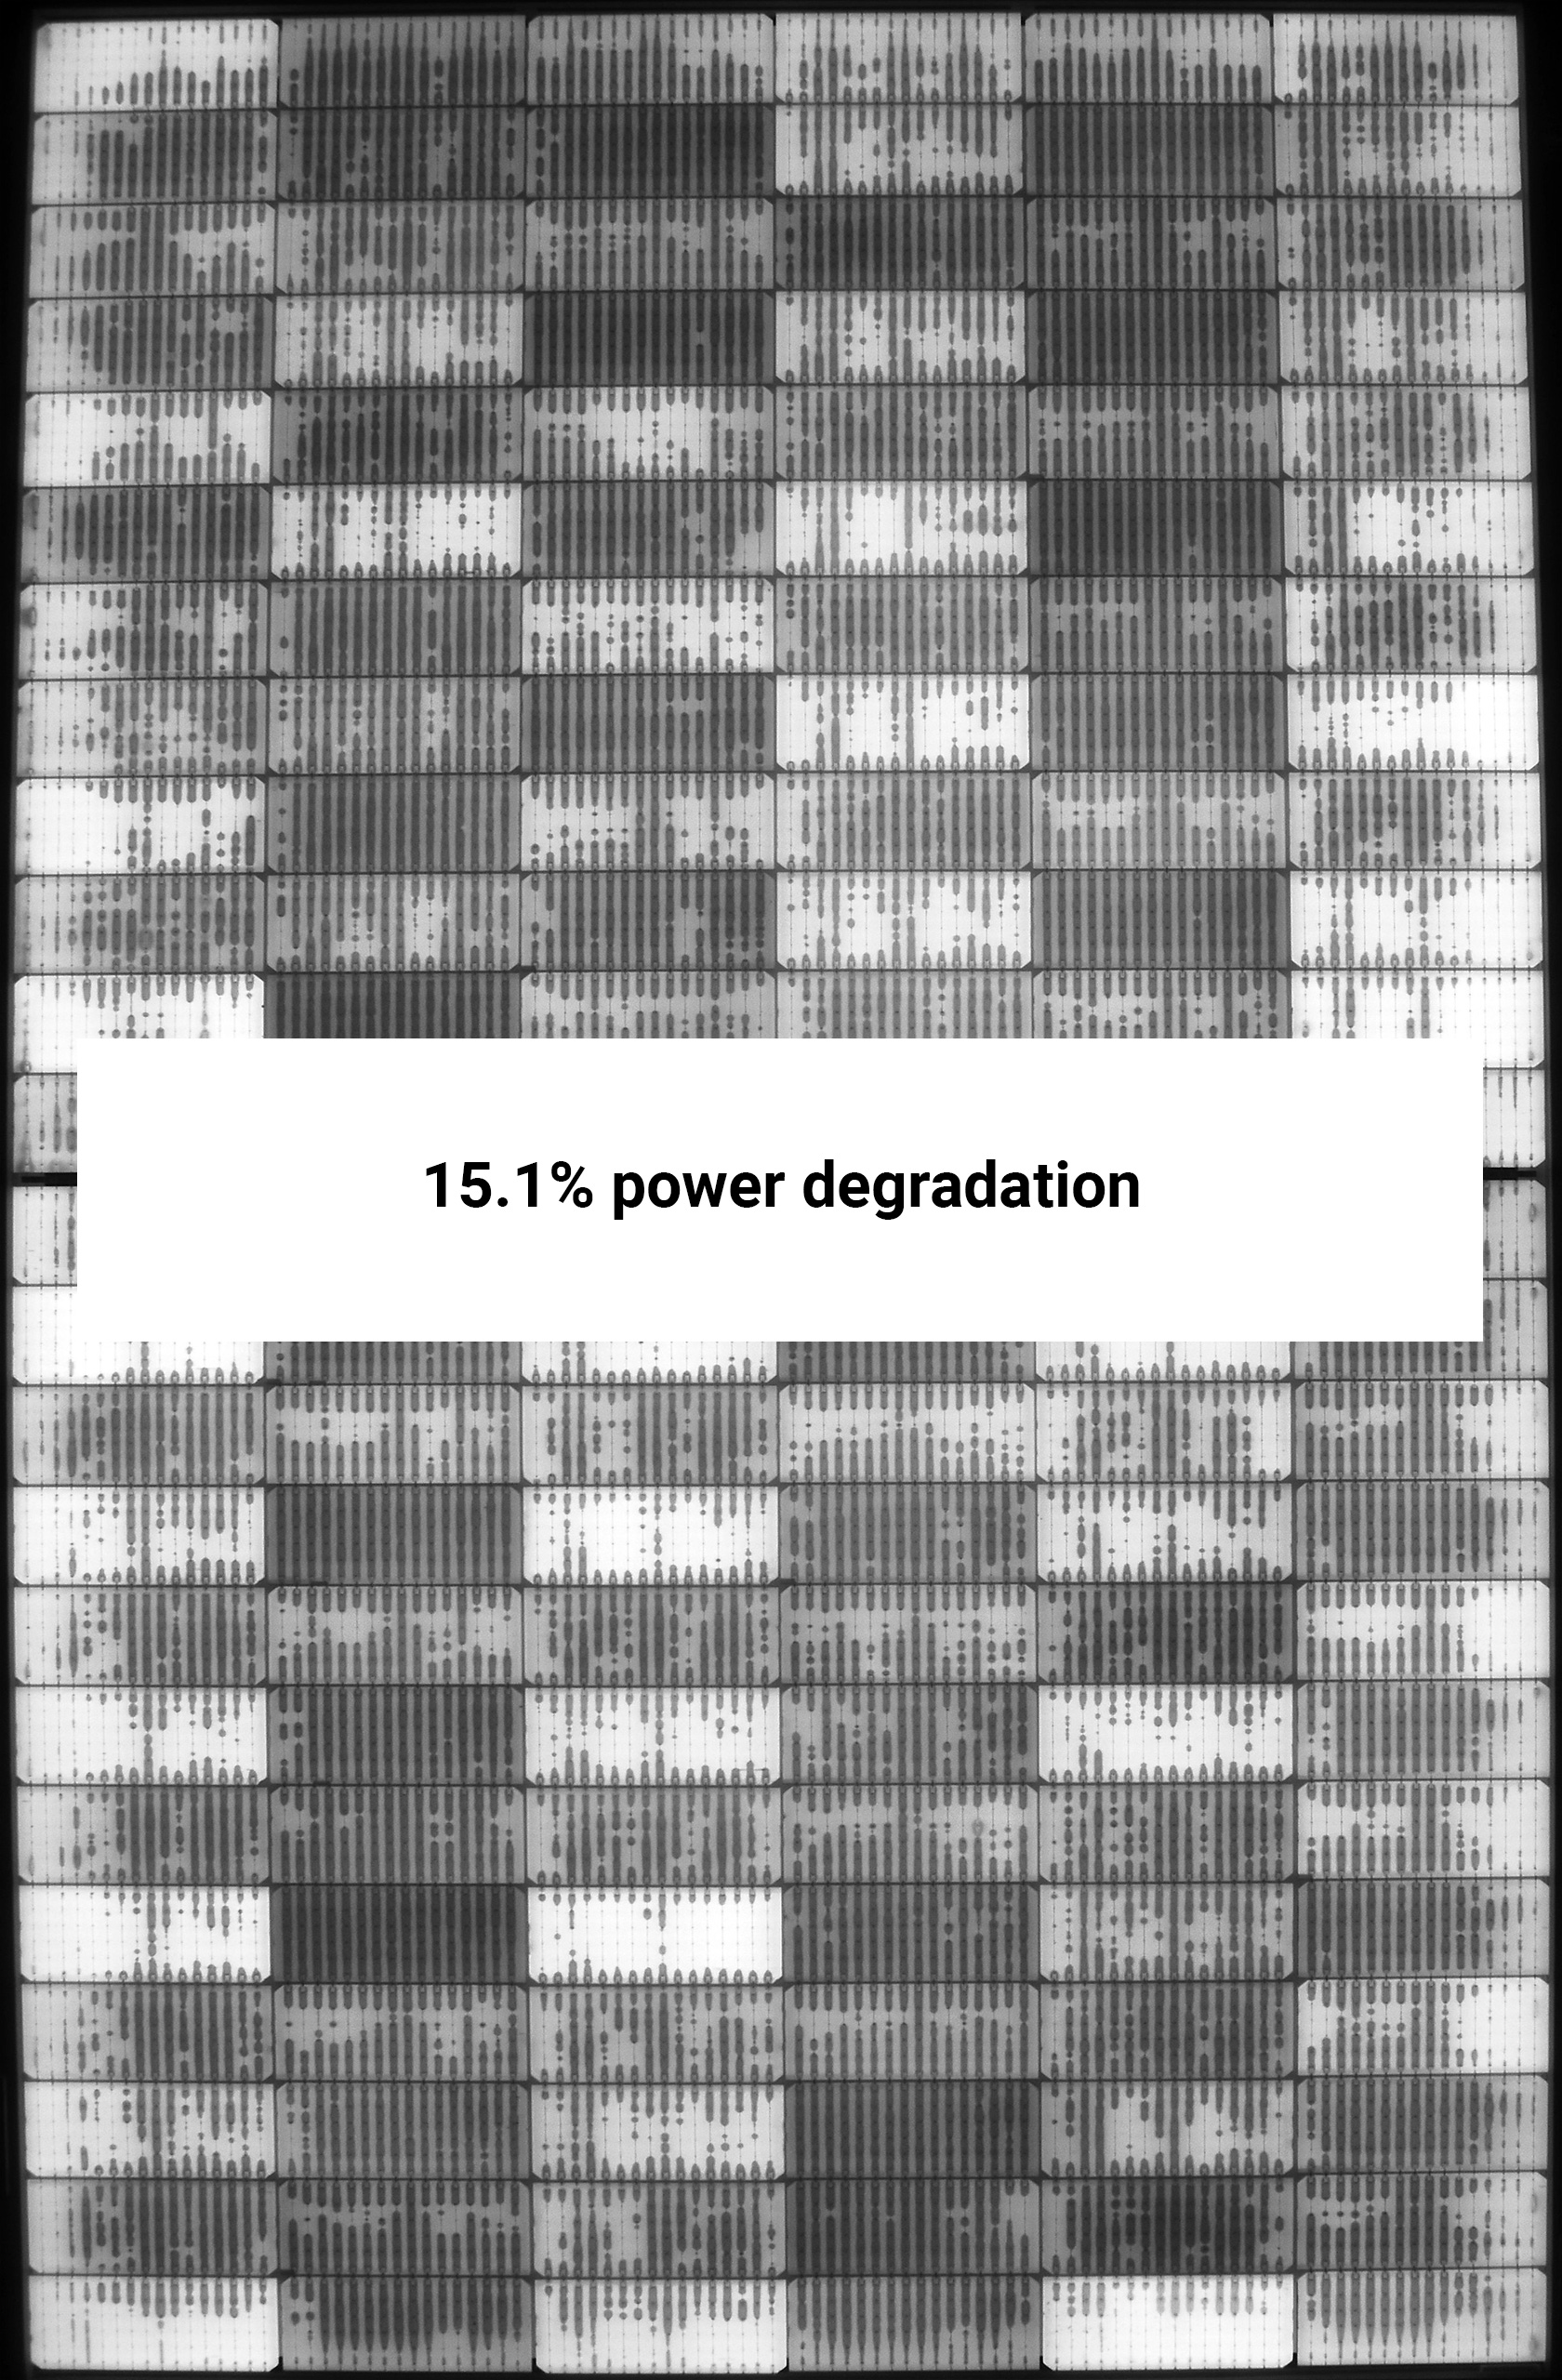
After 192 hours of PID(-) testing, most cell bus bars show an accumulation of polarization charges.
Power Degradation of PID BOMs
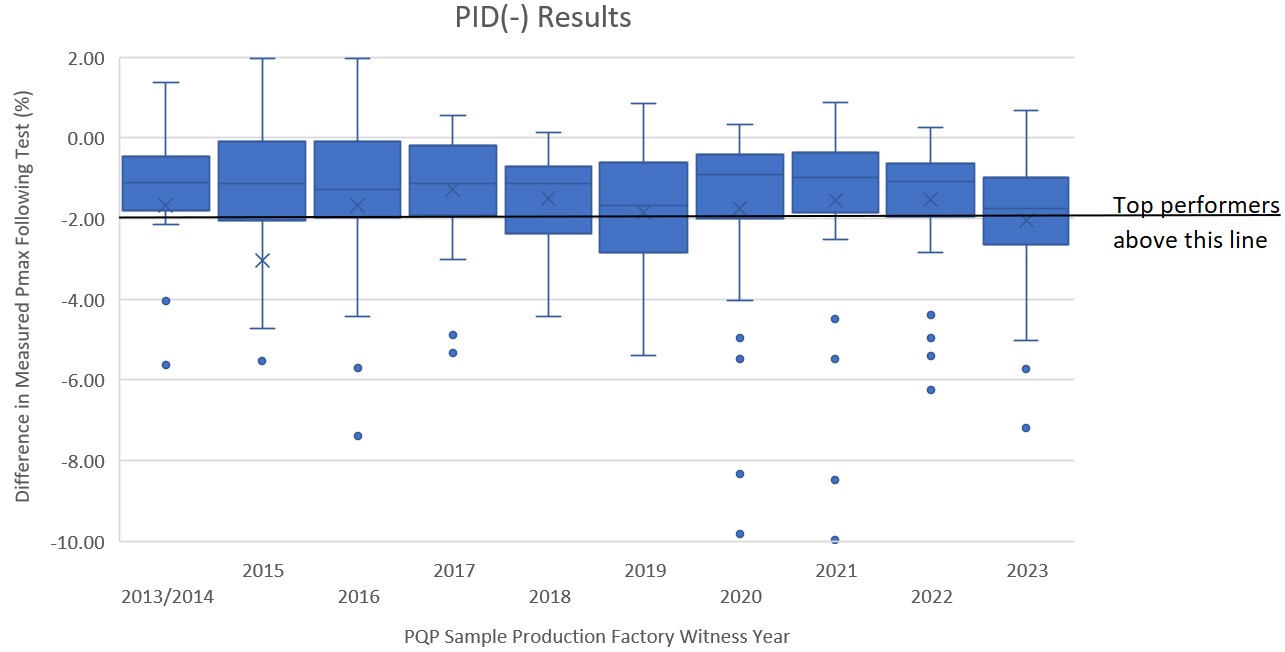
All 2013/2014 and 2015 results are from 600 hours of PID testing. This was decreased to 192 hours for 2016 results and beyond. Outliers with >10% degradation are not shown. In some cases, these cause a significant reduction in the mean.
A case study on why PID is important, what PV module materials are assessed, and the test procedure can be found here on kiwa.com/pvel.

Procure better modules. Get access to the Scorecard data every quarter.
Sign up as a Kiwa PVEL Premium Partner