This was similar to the 72% reported in last year’s Scorecard, with a median degradation following DH of 1.3% for BOMs produced in 2022 and 1.6% for BOMs produced in 2023. Similar to TC, the number of outliers and failures has also increased. See the Power Degradation graph below for more.
Damp Heat

The PQP’s Damp Heat (DH) test is 2000 hours, double the duration of the IEC/UL certification test. For susceptible modules, this test instigates long-term degradation and failure modes that are typical in high temperatures and high humidity conditions where moisture and heat can weaken the materials binding the module together. When these bonds weaken due to low-quality components and/or substandard lamination processes, moisture can enter the laminate and cause corrosion and/or delamination.
Key
Takeaways
Only 69% of BOMs tested degraded by < 2%.
Glass//glass had lower degradation, but both can suffer delamination.
85% of glass//glass BOMs had power degradation less than 2% following DH2000, but only 46% of glass//backsheet BOMs met this threshold. While this shows the advantages of glass//glass laminates in preventing moisture ingress, Kiwa PVEL observed an increasing number of both glass//glass and glass//backsheet BOMs exhibiting bubbles and delamination following DH compared to last year.
Minimal differences between PERC and TOPCon. HJT has some room for improvement.
The median degradation rate for PERC and TOPCon was 1.4% and 1.6%, respectively, with glass//glass BOMs generally performing better than glass//backsheet for both cell technologies. HJT had a smaller sample size of BOMs tested, but showed a wider range in results from < 1% degradation to > 6%.
11% of BOMs experienced one or more failures during DH testing.
The DH failure rate was double that reported in the 2023 Scorecard, with 15 manufacturers experiencing at least one failure during DH testing. These were due to delamination (see the Test Result Spotlight below), junction box lids falling off, electrical insulation faults and power loss. See the Failures page for more.
Test Result Spotlight
A recent example of post-DH2000 delamination is shown here, with bubbles encroaching from the glass//glass laminate edge (under the frame) to the bussing ribbon and onto the cell surface. This creates a safety risk by forming a potential path from the module’s current carrying parts to the grounded frame, and is a non-compliance for IEC 61730. The potential root causes of this could be various cost cutting measures, including the use of POE + EVA encapsulant rather than more traditional POE + POE; a reduction in encapsulant thickness; and/or a reduction in lamination time.
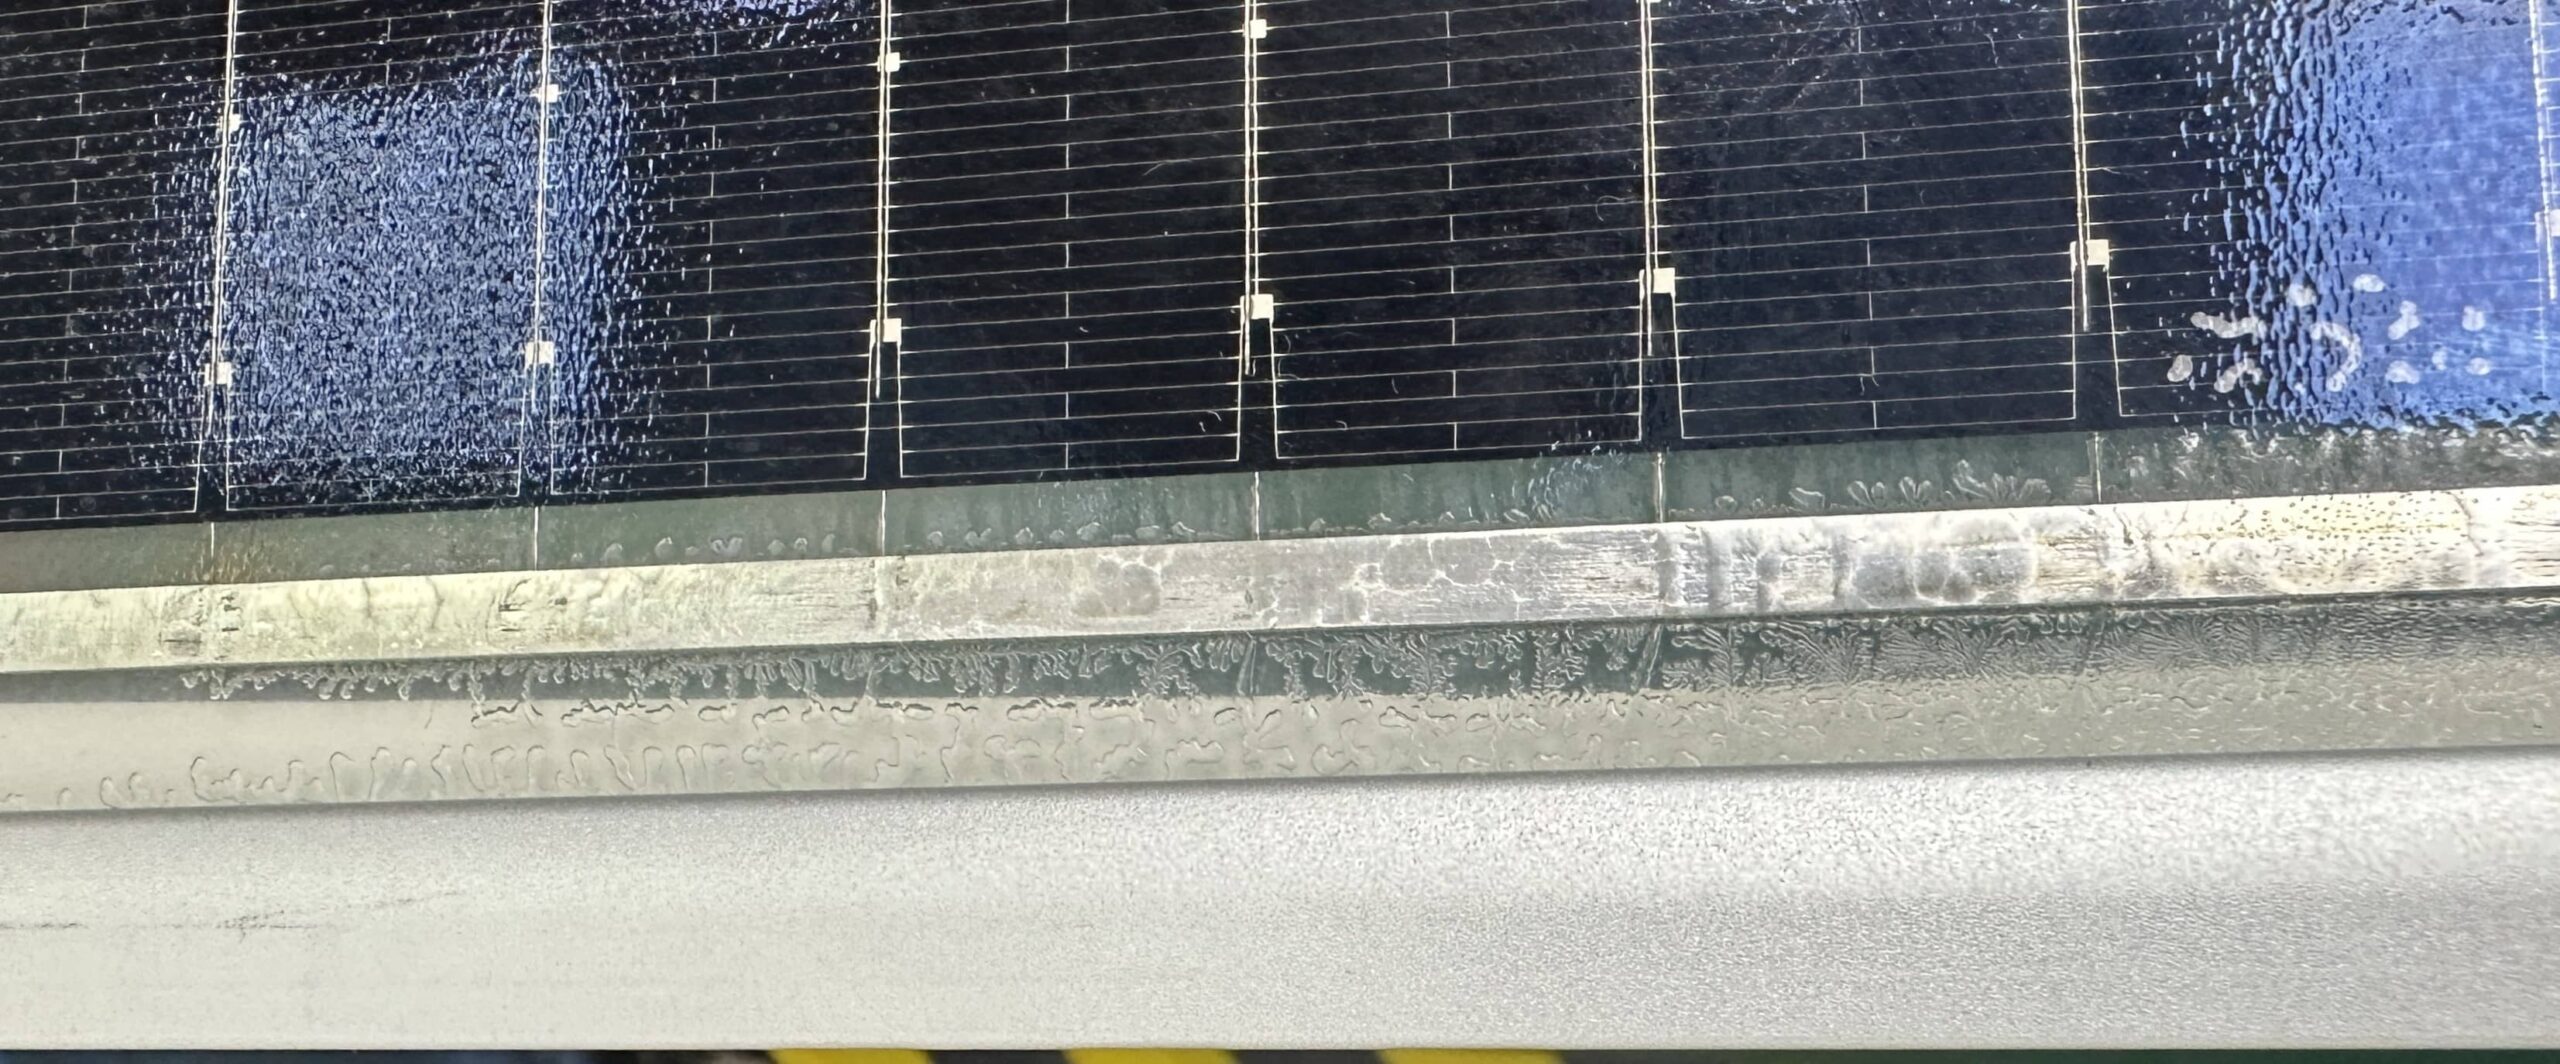
Bubbles can be seen on both sides of the busbar extending from under the frame to the cell, as well as on the cell surface (on the right side of the image).
Power Degradation of DH BOMs
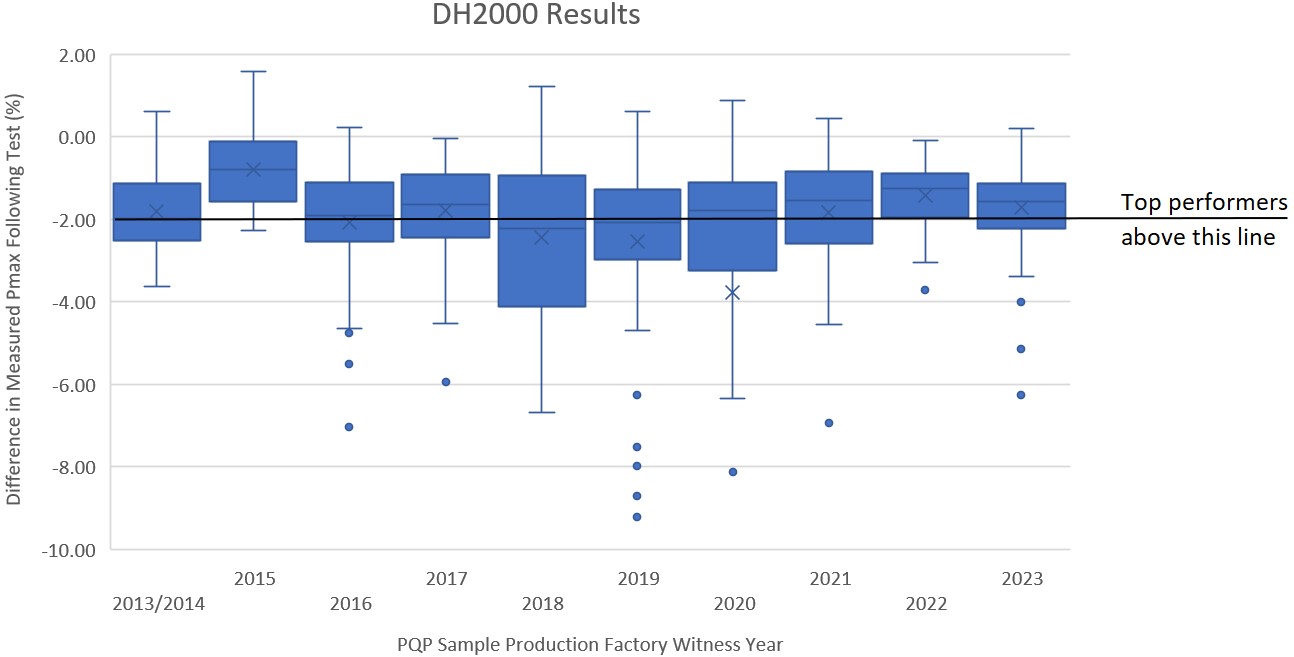
Percentage of results shown that are post-BO stabilization: 19% of 2018, 46% of 2019, 95% of 2022, 86% of 2021. All 2022 and 2023 results are post-DH2000 (pre-BO stabilization), which is the stage in DH testing used to determine Top Performers for the 2024 Scorecard. Some outliers with >10% degradation are not shown.
Outliers with >10% degradation are not shown. In some cases, these cause a significant reduction in the mean.
A case study on why DH is important, what PV module materials are assessed, and the test procedure can be found here on kiwa.com/pvel.

Procure better modules. Get access to the Scorecard data every quarter.
Sign up as a Kiwa PVEL Premium Partner