This same value was reported in last year’s Scorecard, and while the median degradation following TC was also aligned with last year (0.8% for BOMs produced in 2023 versus 0.7% for BOMs produced in 2022), the number of outliers and failures has increased. See the Power Degradation graph below for more.
Thermal Cycling

The PQP’s Thermal Cycling (TC) test extends the IEC/UL certification test from 200 to 600 cycles, more accurately simulating a PV module’s lifespan of temperature fluctuations. TC’s extreme temperature swings stress module components, degrading bonds within the module and junction box that could substantially reduce performance. This test is crucial for environments with significant day-to-night temperature differences.
Key
Takeaways
84% of BOMs tested degraded by < 2%.
0.6% median degradation for glass//glass versus 1.7% for glass//backsheet.
95% of glass//glass BOMs had < 2% degradation following TC600 versus only 50% of glass//backsheet BOMs. This is likely due to the cells being better protected from uneven thermal expansion stresses in a symmetrical glass//glass laminate rather than in an asymmetrical glass//backsheet laminate.
PERC and TOPCon aligned. HJT showed improvements from last year.
The median degradation rate for PERC and TOPCon was 0.6 and 0.7%, respectively, but the number of power degradation failures was higher for TOPCon modules with five TOPCon BOMs recording a failure versus one PERC BOM. The few HJT BOMs produced in 2023 showed stronger TC results than those from previous years.
11% of BOMs experienced one or more failures during TC testing.
11 manufacturers experienced at least one failure during TC testing, including some major junction box issues such as shorted bypass diodes, exposed wires and melted connectors. Six BOMs also experienced power degradation that was significantly more than the manufacturers’ anticipations. See the Failures page for more.
Test Result Spotlight
Kiwa PVEL continues to uncover cases of modules that perform exceedingly well for the IEC 61215 standard’s 200 thermal cycle test duration, but significant issues are uncovered during the PQP’s extended test. In this example, the module had negligible power loss after TC200, but the degradation reached over 5% following TC600. The EL images resemble some other TOPCon BOMs tested in the past year, with increasing evidence of high resistance areas. This is possibly due to the change to aluminum and silver paste, rather than just silver metallization.
TC200
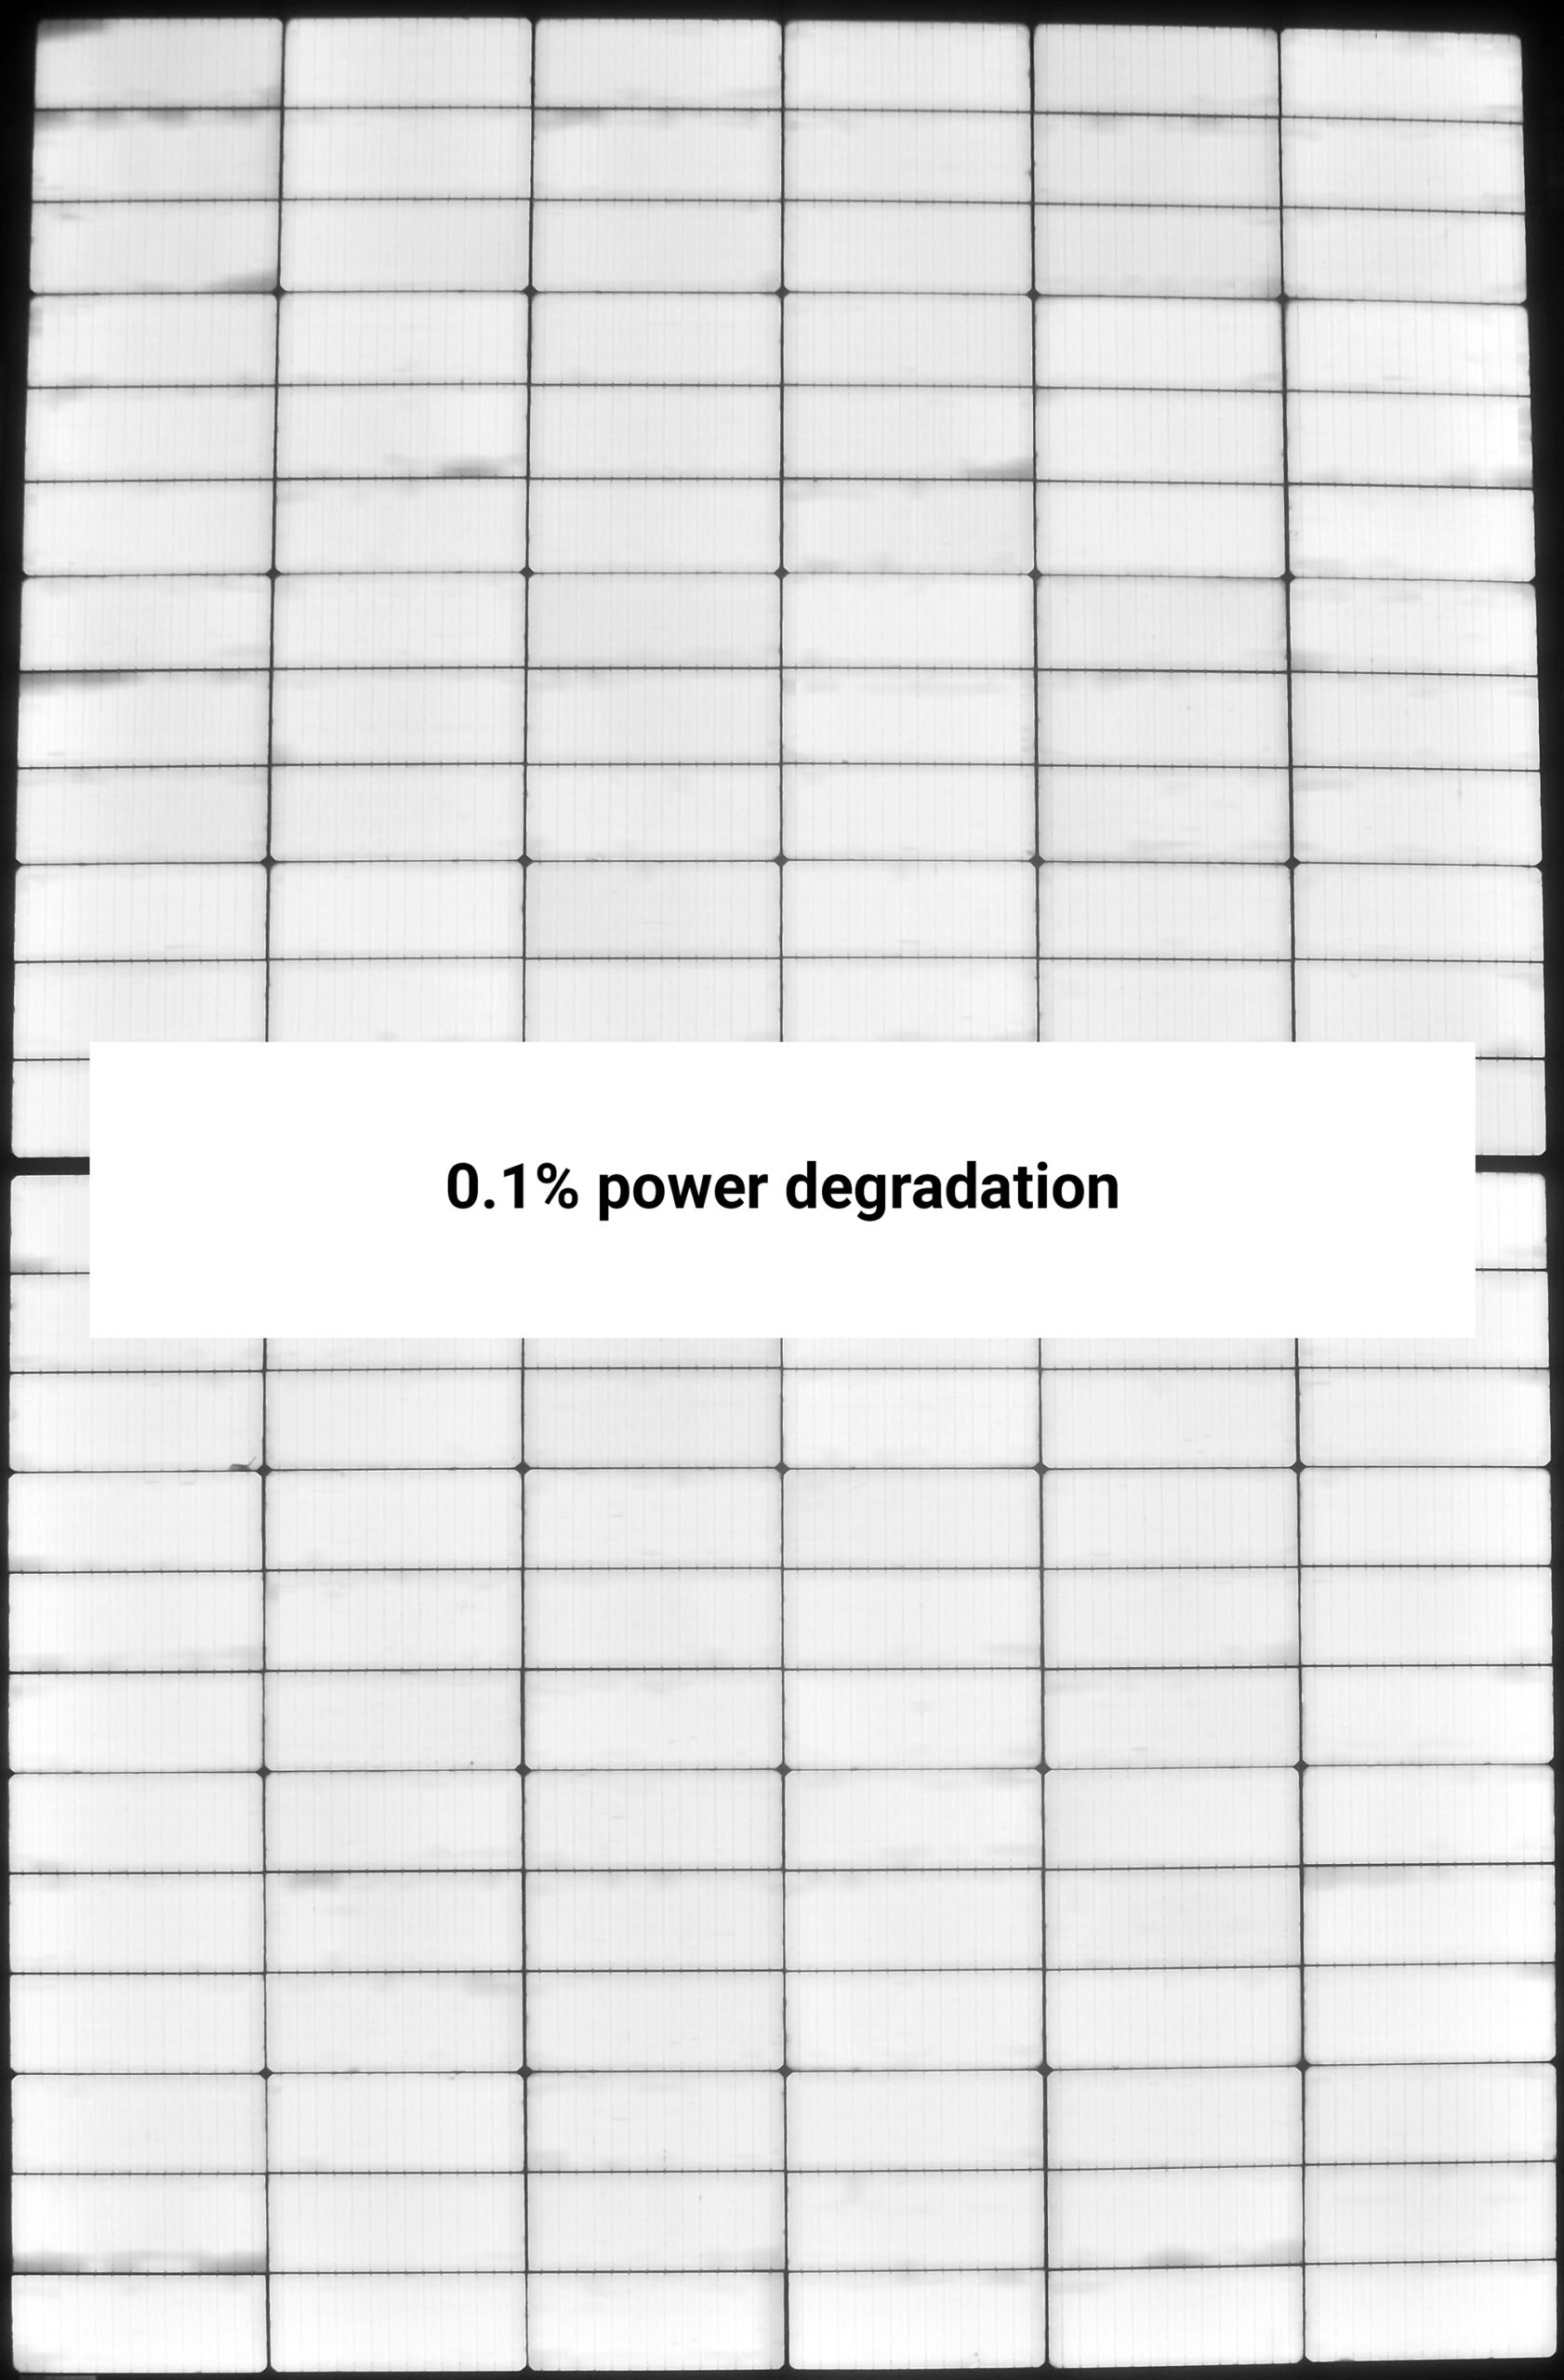
The module performs exceptionally well after TC200 with almost no power degradation.
TC400
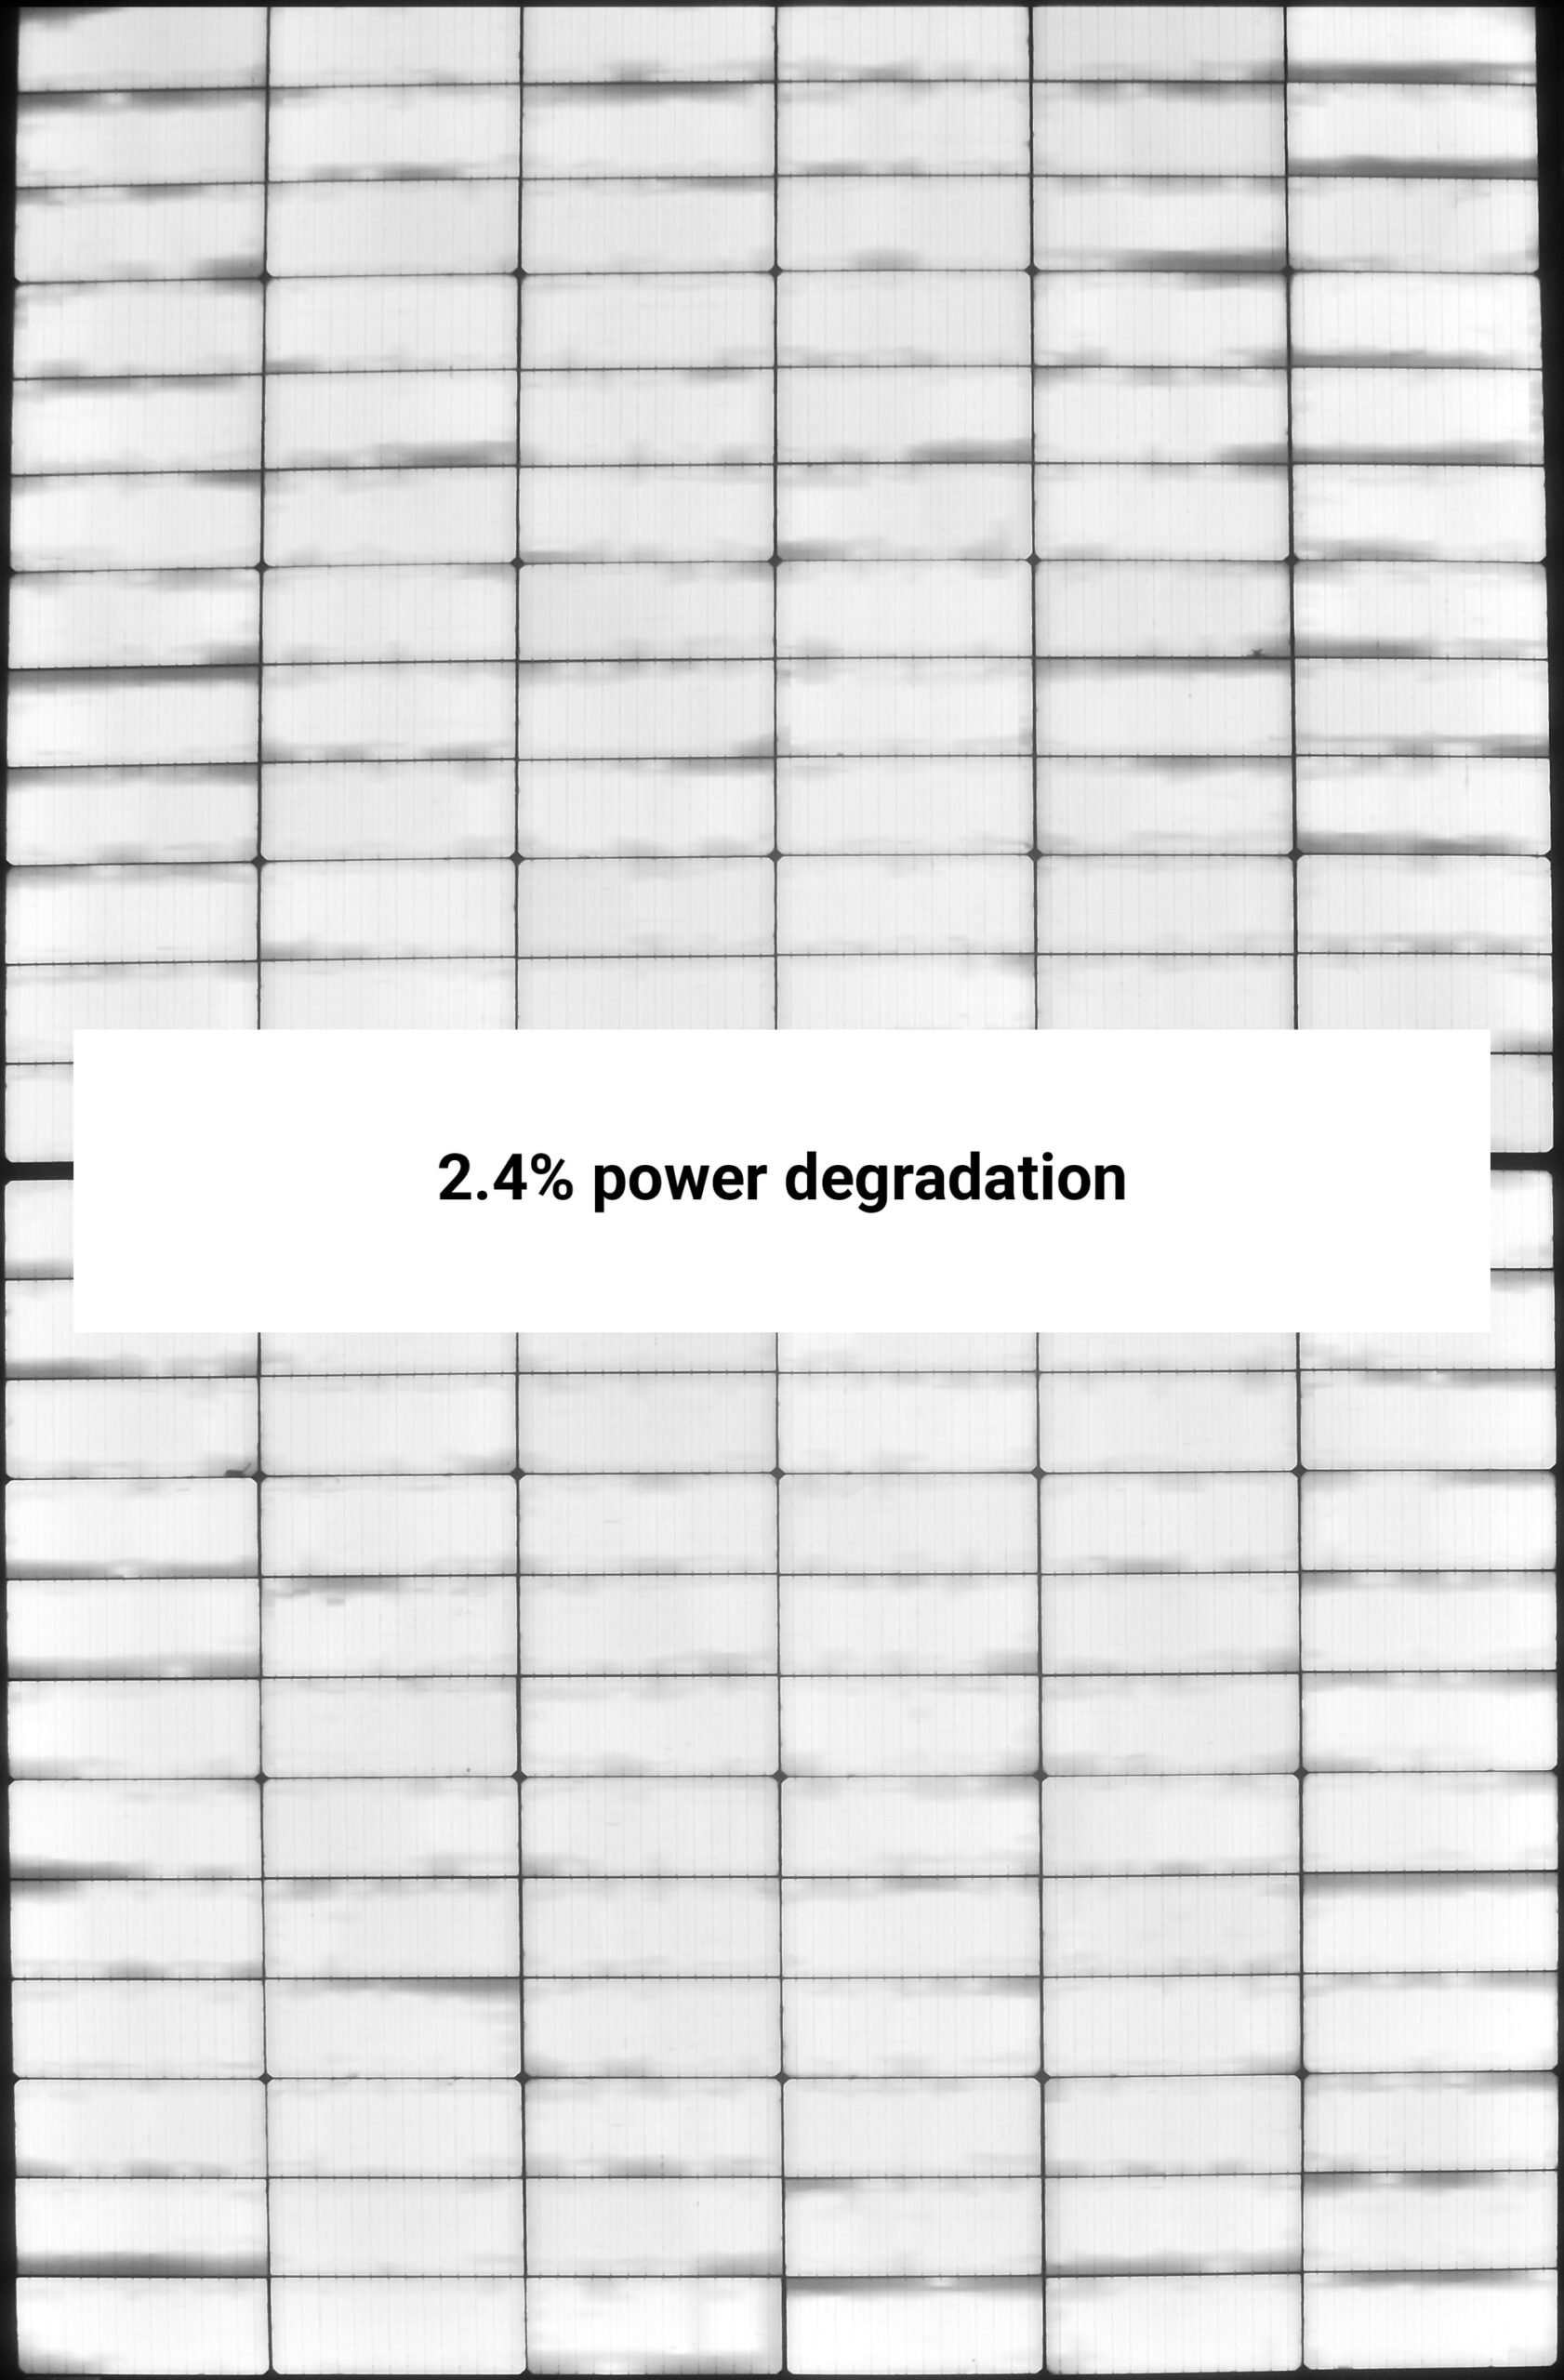
After TC400, the power loss has increased to 2.4% and higher resistance (darker) areas can be seen.
TC600
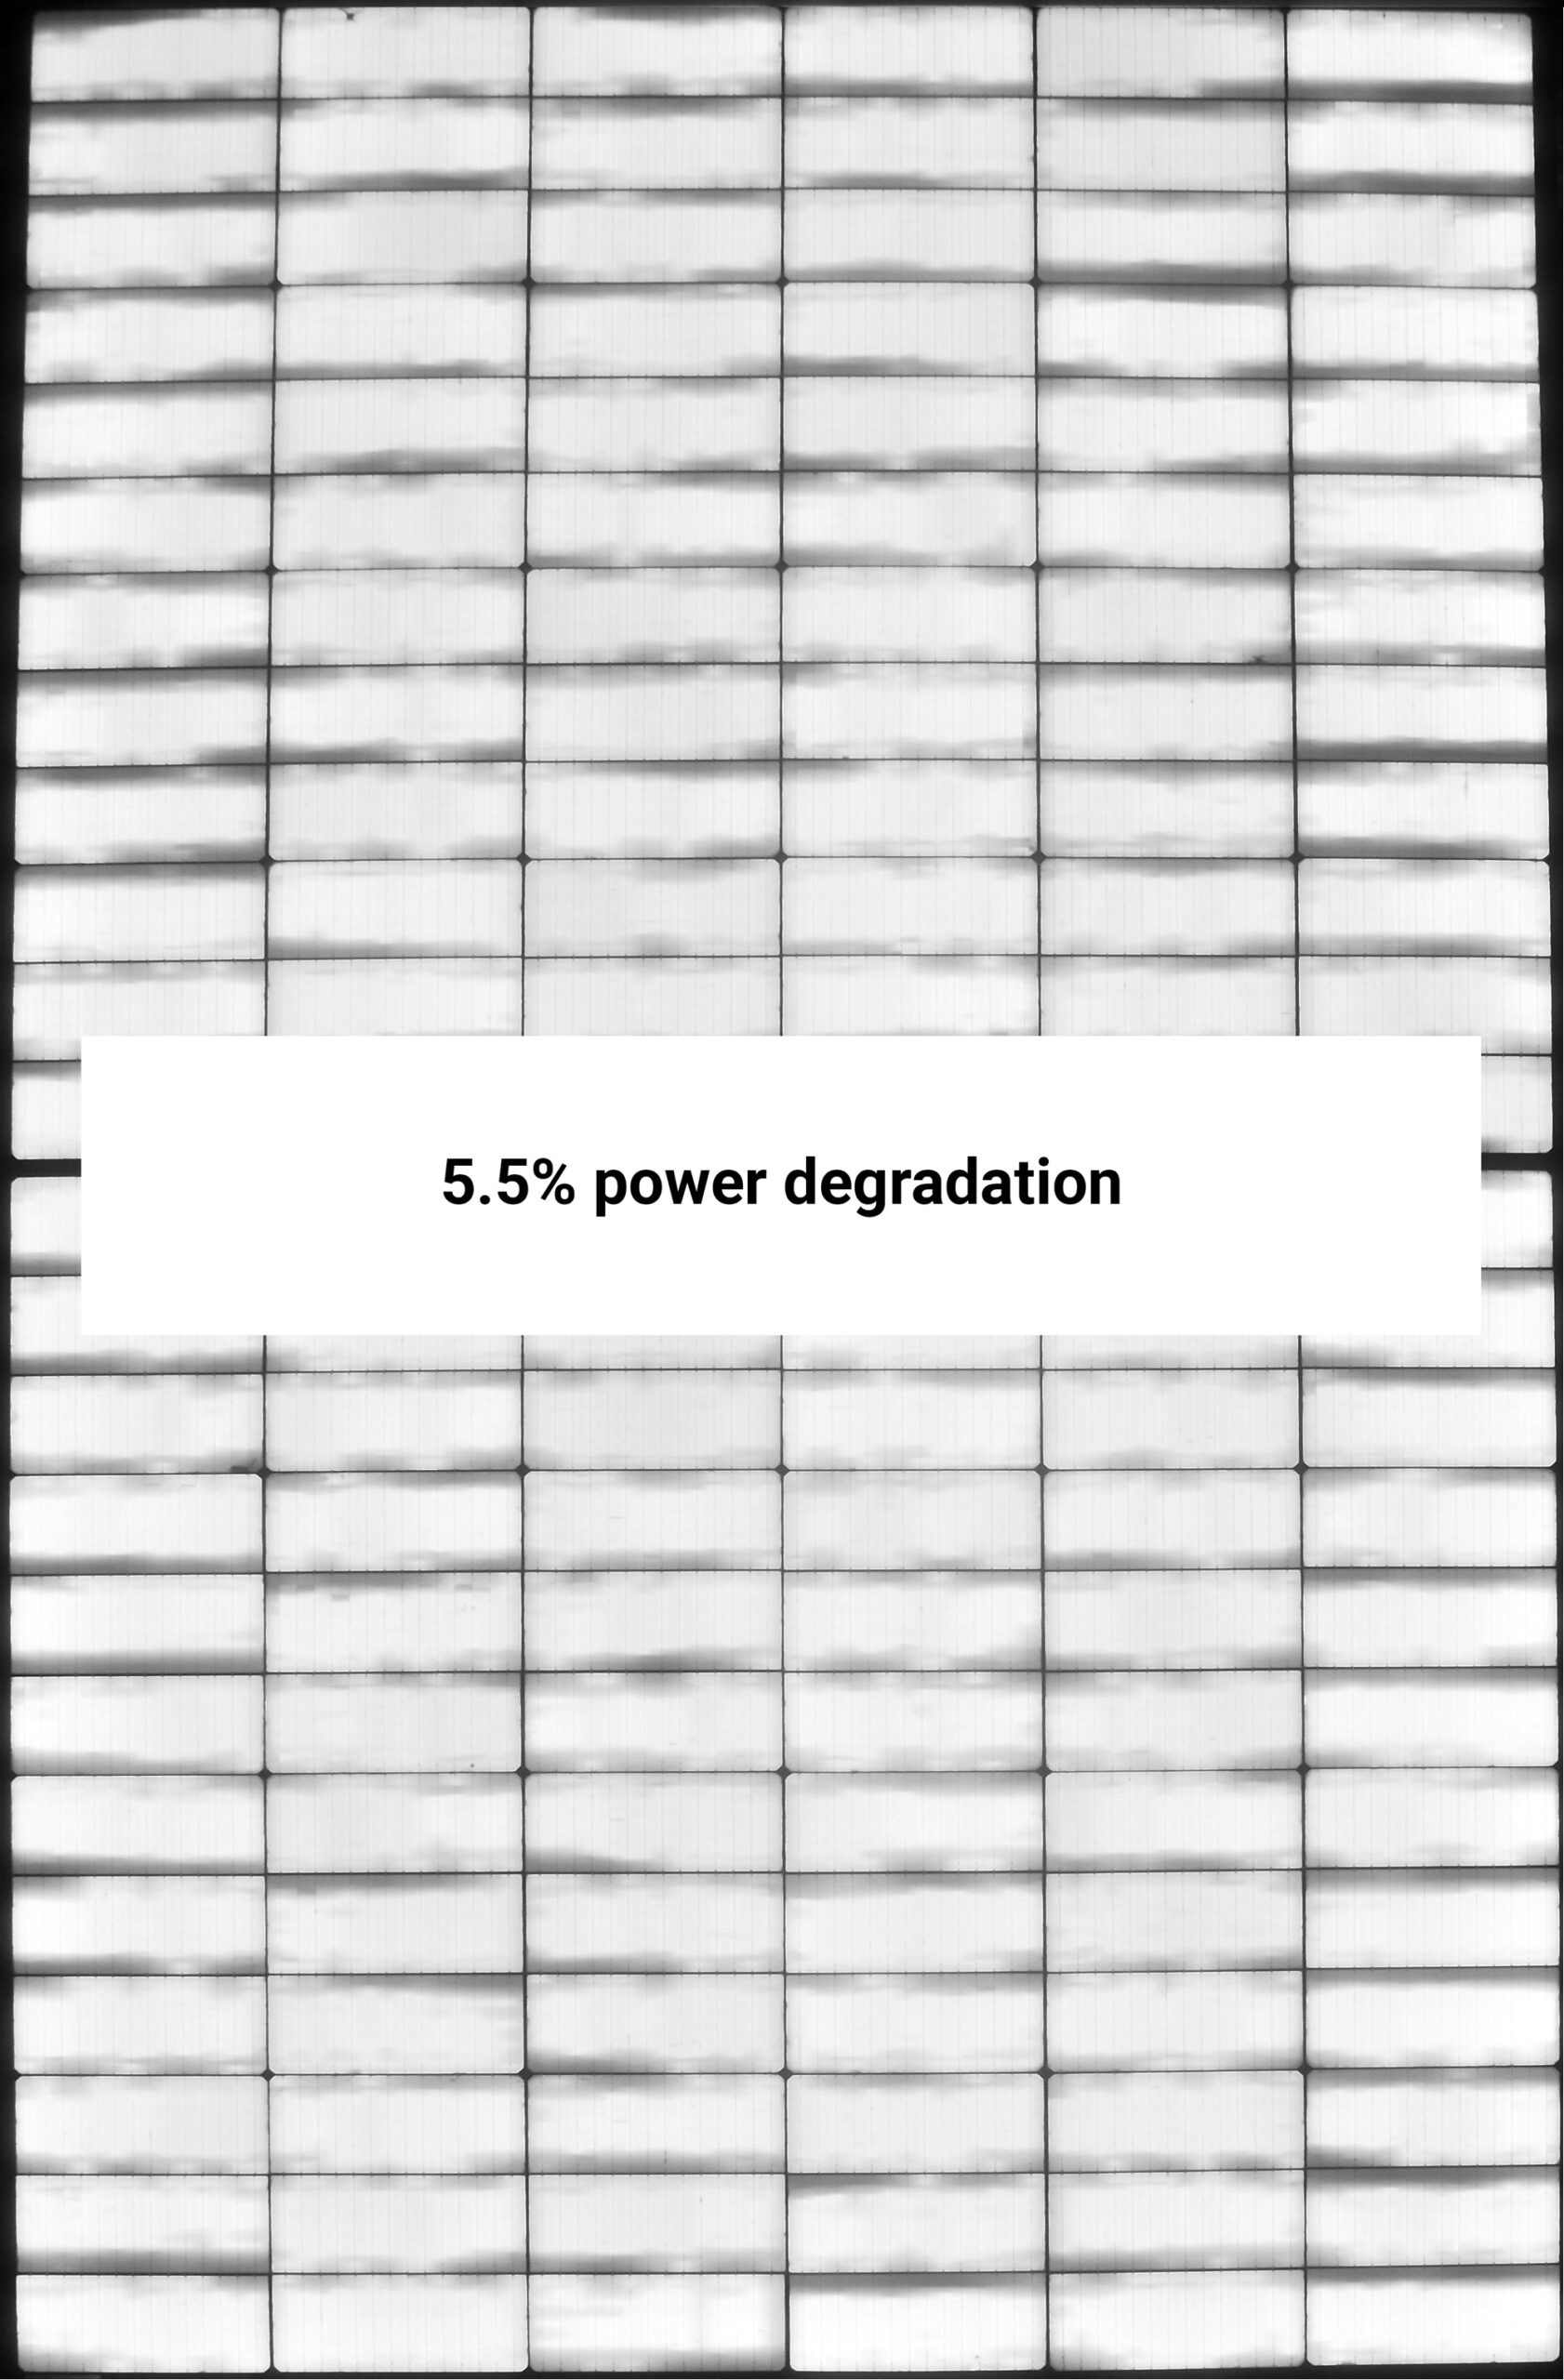
After TC600, the power loss has exceeded 5% and the higher resistance areas are more pronounced.
Power Degradation of TC BOMs
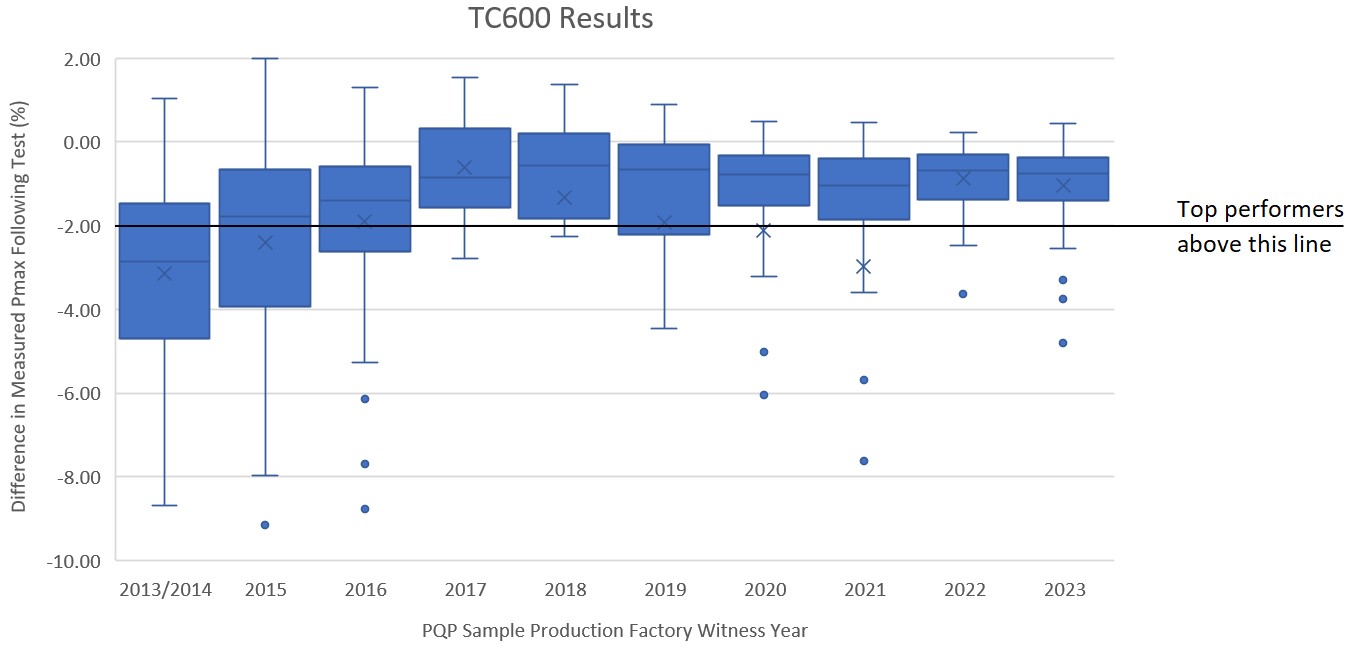
Outliers with >10% degradation are not shown. In some cases, these cause a significant reduction in the mean.
A case study on why TC is important, what PV module materials are assessed, and the test procedure can be found here on kiwa.com/pvel.

See Thermal Cycling Top Performers
Click here to see the 150 model types listed as TC Top Performers.
Procure better modules. Get access to the Scorecard data every quarter.
Sign up as a Kiwa PVEL Premium Partner